![]()
![]()
![]()
![]()
|
|
|
|
|
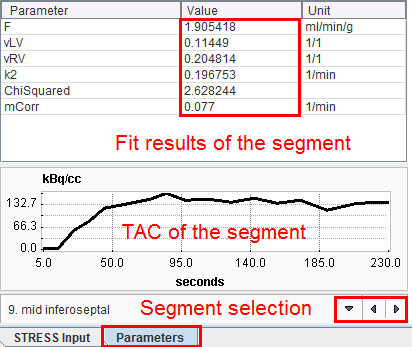
Parameters per Segment
The Parameters tab on the Kinetic Modeling page shows the modeling results obtained with the individual segmental TACs. After a segment has been selected, the result parameters are shown in the upper table, and the corresponding TAC in the lower curve area.
Polar Plots
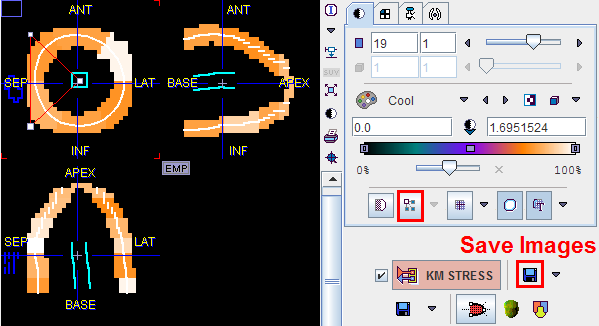
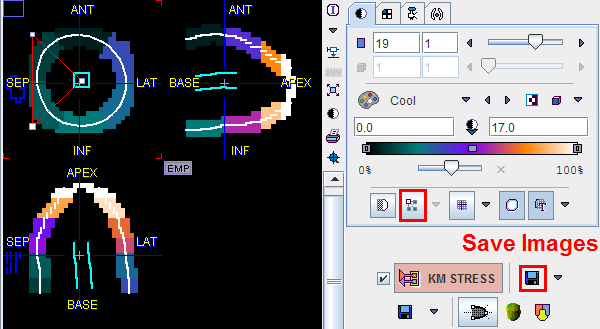
The parameters resulting in the different segments can conveniently be visualized as polar plots. The example below shows the polar plot of the parameter flow (F) , without interpolation and with the display controls enabled. By default, segments definition is overlayed. These can be easily switched off selecting the toogle button ![]() available on the lower right corner of the polar plot. A list selection is available at the bottom to switch between the parameters. When the cursor is moved about the polar plot the instantaneous value is shown in the upper right. Note that the segment structure is clearly visible if no interpolation has been configured for the polar plot. The polar plot can be documented by the Polar Plot report.
available on the lower right corner of the polar plot. A list selection is available at the bottom to switch between the parameters. When the cursor is moved about the polar plot the instantaneous value is shown in the upper right. Note that the segment structure is clearly visible if no interpolation has been configured for the polar plot. The polar plot can be documented by the Polar Plot report.
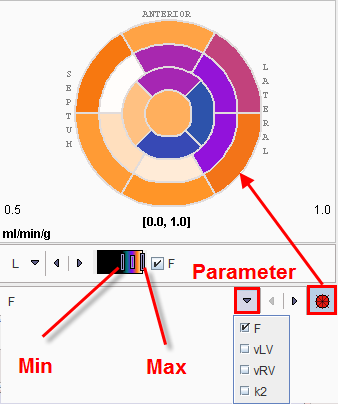
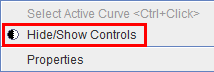
The polar plot display control can be easily switch on/off right clicking on the polar plot area and selecting the Hide/Show Controls option.
Activating the last option on the list, Properties, the display properties like Description's font size can be changed.
Resampled Data and Parameter Images
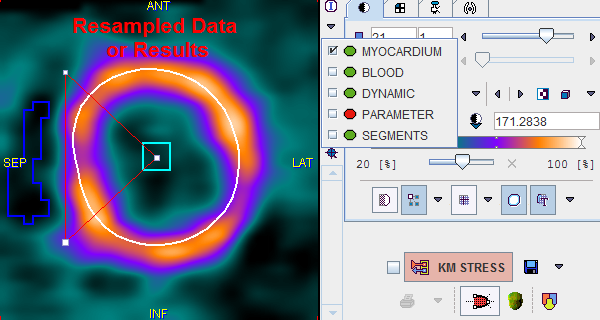
The image display on the right side of Kinetic Modeling page initially shows the MYOCARDIUM data. Note, however, that you can switch between more studies by the list selection as illustrated below. Green bullets represent data already available, while red bullets mark data which still needs to be calculated (in the example modeling has not yet been performed).
All this data has been resampled based on the Myocard VOI, so that the 20 slices cover the area from the apex to the base, plus some additional bounding box.
DYNAMIC |
Resampled dynamic image data. Use the volume slider to step through the different acquisition times. |
BLOOD |
The data calculated in the pre-processing step as a representation of blood. |
MYOCARDIUM |
The data calculated in the pre-processing step as a representation of myocardium (already illustrated above). |
PARAMETER |
The calculated active parameter (eg. flow F) turned into a volumetric image (one value per segment). The interpolation has been disabled in the illustration above to clearly demonstrate the segmental parameter values. Note that the result images can be saved, for instance for fusion with a matched anatomical data set. |
SEGMENTS |
Illustration of the segments. Note: The representation is based on the myocardium contour. The actually sampled voxels may differ to some extent depending on the sampling scheme. |
Note: If you click into the polar plot, the image to the right is adjusted so that the corresponding slice is shown. With an orthogonal image layout, the cross is positioned at the sampling location corresponding to the polar plot point.
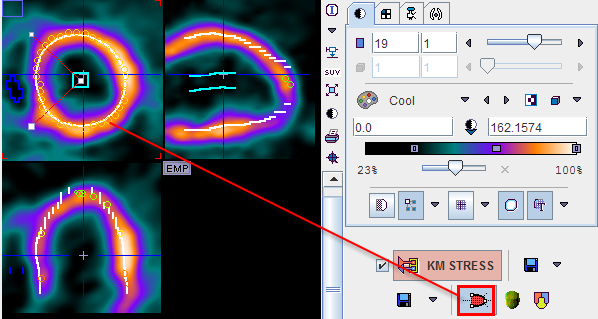
Visualization of the Samples found by Polar Sampling
The pixels found during the sampling process can be visualized together with the short axis images. As soon as the button

is activated, small circles are shown in the overlay. They represent the intersection of a sphere around the sampling point with the imaging plane. Therefore, particularly in the apical segments, the circles can be of different diameter because of the there-dimensional geometric arrangement.
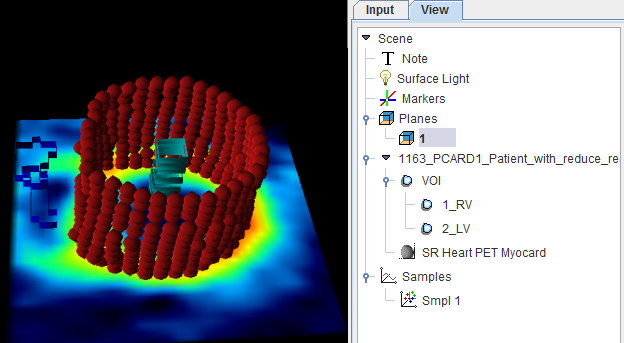
A better representation of the sampling points can be obtained by a 3D representation, which is only available if the P3D option has been purchased. In this case, the
![]()
button is present. When it is activated, the shape of the myocardium model is rendered together with the sampling points. The example below shows the sampling points as red spheres, the myocardium model as a surface with the texture of the MYOCARDIUM image, and a short axis slice of the anatomical images with transparency.
If a sampling scheme with averaging has been selected, the neighbor points are rendered as separate sphere objects in green as illustrated below.
To learn more about the many possibilities exploring the data in P3D please refer to the P3D User's Guide.