![]()
![]()
![]()
![]()
|
|
|
|
|
The dialog window for the statistics output is illustrated below. The R page only appears when R statistics is enabled.
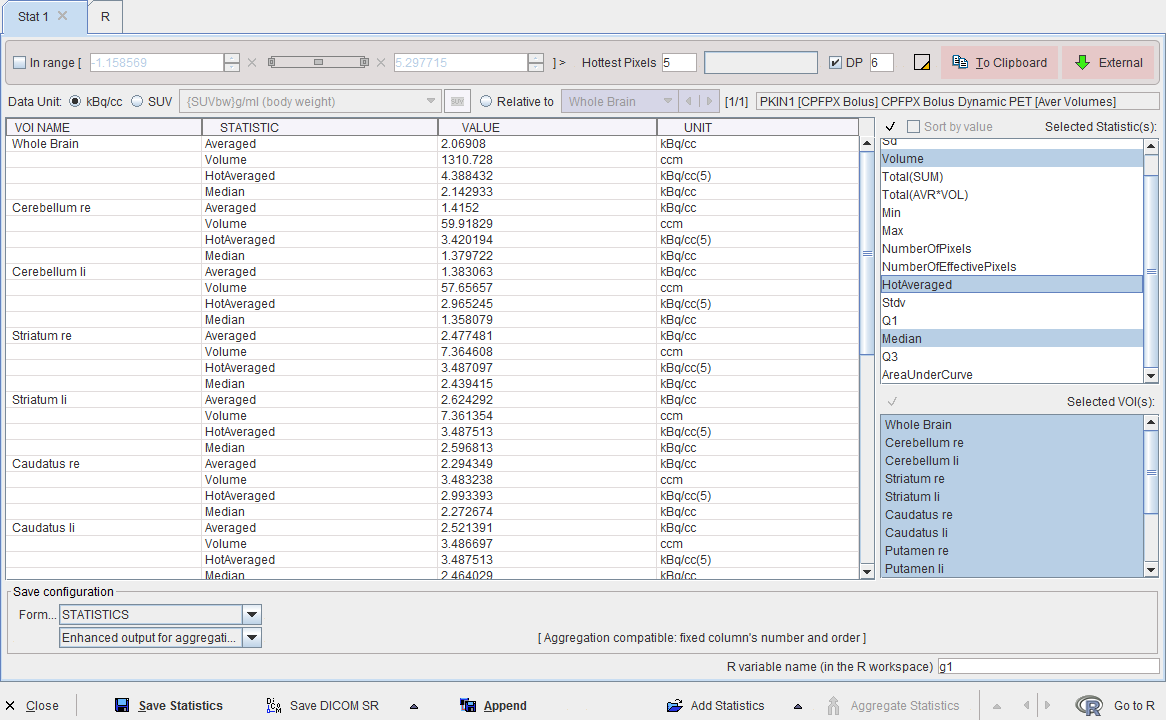
The calculated information is comprehensive and can be tailored by several user interface elements.
Selected Statistics
The list to the right shows all available statistics figures. It serves for selecting the statistics of interest. Only the selected elements are be shown in the table and will be exported. The default selection includes the Averaged and the Sd.
Selected VOIs
The second list in the lower right shows all available VOIs which were evaluated as well as a Group element. Only the selected elements are shown in the table and will be exported.
Range Restriction
Note the In range box which allows restricting the statistics to the subset of pixels with values in a specific range. For example, by setting the lower threshold to 40% of the maximum it is possible to calculate the average value and the volume of all pixels above 40%.
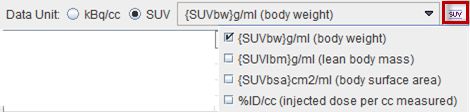
SUV Statistics
If the statistics are calculated for activity concentration images, the uptake results can be converted to different types of SUV images under the condition that the related activity information is available in the image header. If not, but the information is available, it can be entered after activating the SUV button
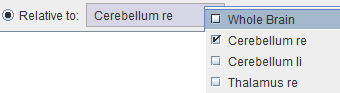
SUVR Statistics
The so-called SUVR statistics is the uptake divided by a reference uptake. It can easily be obtained by switching to the Relative to radio button and selecting the reference region from the VOI list. Note that the ratio is also calculated for all other statistical measures.
Saving Options
There are several options to chose from when saving the statistics. The Format selection has three choices.
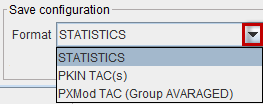
STATISTICS is a tabular format aimed at statistics programs. PKIN TAC(s) is aimed at loading the saved information as tissue curves into the kinetic PKIN tool. PXMod TAC will only export the time-activity curve of the Group VOI in a two-column format. This data is intended for use in the pixelwise modeling tool PXMOD.
The second option choice

is only available for the STATISTICS output.
Please use Save for saving the data in a new tab-delimited text file, and Append for appending it to an existing statistics file.
Furthermore, the statistic results can be saved as a Dicom structured report with the Save Dicom SR option or exported as a structured report with the Export Dicom SR.
Load Statistics Files
Statistics files saved in the STATISTIC/Enhanced output for aggregation format can be loaded back into the statistics viewer. There are several ways to do so:
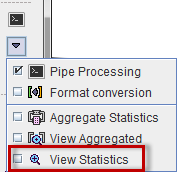
from the VOI interface using the View Statistics option in the Statistic selection list; 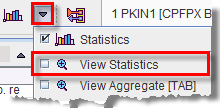
Multiple Statistics
If the statistics is calculated for multiple files, the results are shown in the statistics viewer on separate pages. Similarly, when loading a statistics from a file, a new page is added to the statistics viewer. In this case, the Aggregate Statistics button becomes active and allows creating an aggregate from all open statistics pages.
Transfer to R
The statistics viewer includes an interface to the R statistics environment, if this feature is configured. The Go to R button will transfer the statistics of all open data to the R console creating one R variable per tab with the name taken from the R variable name field.