![]()
![]()
![]()
![]()
|
|
|
|
|
The result of radial sampling is visualized on the REST Input or Stress Input tab of the Kinetic Modeling page. The frame selection allows scrolling through the uptake times and monitor the concentration in the sampled tissue voxels. Note that the polar plot is only available with the automatically outlined myocardium VOI.
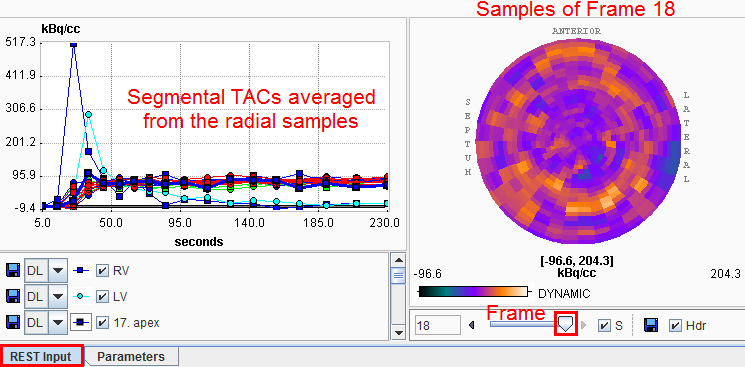
The S checkbox allows syncronizing the polar and image display frames. The dynamic polar sampling can be saved activating the Save icon. Optionally, the header can be appended during the saving procedure enabling the Hdr checkbox. After saving, the polar plots can be analyzed outside the PMOD software.