![]()
![]()
![]()
![]()
|
|
|
|
|
The Simplified Reference Tissue Model (SRTM) of Lammertsma and Hume [1] is used for the analysis of studies with reversibly binding neuroreceptor tracers. A reference tissue devoid of receptors is required which can be modeled by a single-tissue compartment model.
The assumptions of the model are:
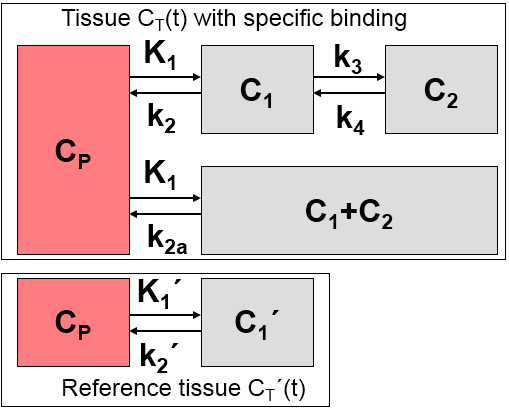
Defining the ratio of tracer delivery R1 as K1/K1' and the binding potential BPND as k3/k4, the following operational equation can be derived for the measured tissue TAC in a receptor-rich region:
![]()
For convolution with the exponentials, the reference tissue TAC C'(t) is resampled on a regular grid, which can be specified by the Resampling parameter.
Gunn et al [2] transformed the SRTM model into a solution which is better suited for pixel-wise application. It is based on a set of basis functions which are generated by convolving the reference TAC with decaying exponentials. The exponents employed should cover a range which is reasonable for the tracer considered. To calculate the binding potential of a TAC a least squares fit is performed with each of the basis functions. That fit with minimal deviation between the TAC and the model curve is regarded as the solution, and the binding potential is calculated from the set of fit parameters.
The PXMOD implementation in the BPnd (SRTM Ref) model differs from that described in [2] by the following points
Acquisition and Data Requirements
Image Data |
A dynamic PET data set with an neuroreceptor tracer which behaves kinetically similar to a 1-tissue compartment model. |
TAC 1 |
TAC from a receptor-rich region (such as basal ganglia for D2 receptors). |
TAC 2 |
TAC from a receptor-devoid region (such as cerebellum or frontal cortex for D2 receptors). |
Model Preprocessing
Two regional TACs (TAC1 and TAC2) are needed for Model Preprocessing.
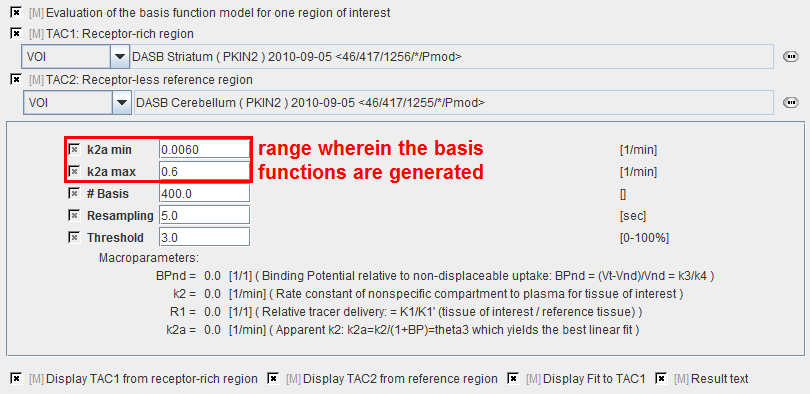
k2a min |
Minimal value of k2a (slowest decay of exponential). |
k2a max |
Maximal value of k2a (fastest decay of exponential). |
# Basis |
Number of basis functions between k2a min and k2a max. Note that increments are taken at logarithmic steps. This number is directly proportional to processing time. |
Resampling |
Specifies the interval of curve resampling which is required for performing the operation of exponential convolution. Resampling should be equal or smaller than the shortest frame duration. |
Threshold |
Discrimination threshold for background masking. |
BPnd |
Estimated binding potential (= k3/k4 according to the underlying model). |
R1 |
Ratio of tracer delivery in each pixel relative to the reference tissue (R1=K1/K1'). |
k2 |
Estimated rate constant k2. |
k2a |
k2a value which provides the best least squares fit in each voxel. |
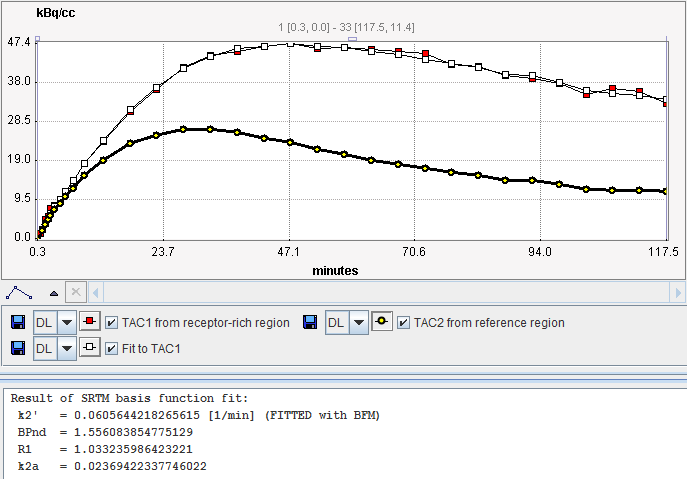
The result of the fit during Model Preprocessing is shown in the Result panel for inspection.
Map Parameters
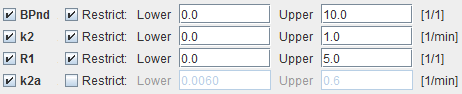
BPnd |
Estimated binding potential (BPnd= k3/k4 according to the underlying model). |
k2 |
Estimated efflux rate constant k2 . |
R1 |
Ratio of tracer delivery in each pixel relative to the reference tissue (R1=K1/K1'). Therefore the map often has a similar appearance to a perfusion image. |
k2a |
k2a value which provides the best least squares fit. |
Notes:
1. The k2a parametric map should be checked in the initial setup of a processing protocol. The estimated k2a values should not be truncated by too narrow k2a min and k2a max values.
2. The calculation is slow relative to other reference models and might take several minutes to complete.
References
1. Lammertsma AA, Hume SP: Simplified reference tissue model for PET receptor studies. Neuroimage 1996, 4(3 Pt 1):153-158. DOI
2. Gunn RN, Lammertsma AA, Hume SP, Cunningham VJ: Parametric imaging of ligand-receptor binding in PET using a simplified reference region model. Neuroimage 1997, 6(4):279-287. DOI