![]()
![]()
![]()
![]()
|
|
|
|
|
The rCBF (Watabe) model was intended for the quantitative assessment of the regional cerebral blood flow. The only required measurement is a dynamic PET acquisition after the injection of a H215O bolus, obviating the need for blood sampling. What is required instead are the time-activity curves of two cerebral regions - a low-flow and a high-flow region. By comparing the TACs of these regions their flows (f1, f2) and distribution volumes (DV1, DV2) can be estimated. Then, the TAC from each pixel can be compared to that of the low-flow region. Its flow and distribution volume are hereby estimated, whereby the previously obtained parameter values of the low-flow region (f1, DV1) and a fixed DV are contained in the calculation prescription.
CAUTION: With practical data it has turned out that the fitting is too dependent on the initial parameter values and does not provide sufficiently stable results.
Acquisition and Data Requirements
Image Data |
A dynamic PET data set representing the measurements of brain activity after injection of a H215O bolus. |
Model Preprocessing
A methodology has been implemented to automatically extract low-flow and high-flow TACs as follows:
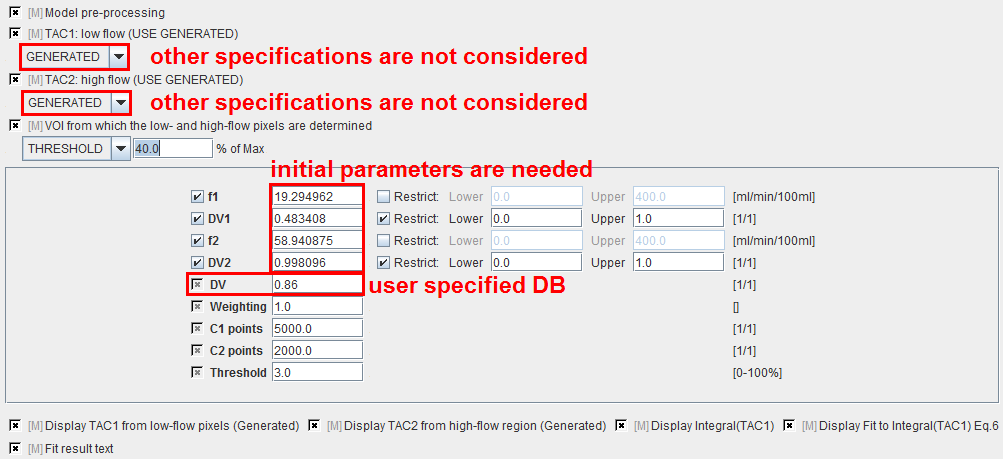
f1 |
Flow in low-flow region estimated during preprocessing and subsequently used in pixel-wise calculations. |
DV1 |
Distribution volume in low-flow region estimated during preprocessing and subsequently used in pixel-wise calculations. |
f2 |
Flow in high-flow region estimated during preprocessing but NOT further used. |
DV2 |
Distribution volume in high-flow region estimated during preprocessing but NOT further used. |
DV |
Fixed distribution volume which is assumed for each pixel-wise TAC. |
Weighting |
Different schemes for residual weighting in the iterative preprocessing fit. |
C1 points |
Number of points used for the generation of TAC1. |
C2 points |
Number of points used for the generation of TAC2. |
Threshold |
Discrimination threshold for background masking. |
After preprocessing, the Watabe plot is shown on the Results panel for inspection. Note that the the integral curves can be deactivated using the check boxes to see the generated TACs.
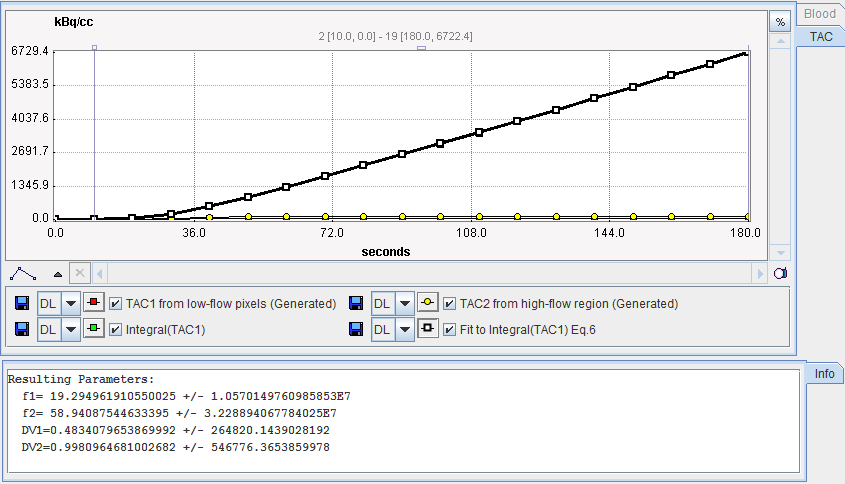
Important Note: Experience has shown that the results of this reference method highly depend on the iterative fit with 4 parameters. As illustrated in this example, the identifiability of the parameters is often poor, and the results may heavily depend on the starting values. In an attempt to make the method more stable, one can fix VD2 to a reasonable value such as 0.9. To this end, just deactivate the box next to VD2 .
Map Parameters

f |
Regional perfusion in [ml/min/100ml]. It is calculated for each pixel by a closed-form calculation (Watabe's eq. 8). Reasonable values are about 30 (white matter) and 60 (gray matter) ml/min/100ml [11]. |
Reference
1. Watabe H, Itoh M, Cunningham V, Lammertsma AA, Bloomfield P, Mejia M, Fujiwara T, Jones AK, Jones T, Nakamura T: Noninvasive quantification of rCBF using positron emission tomography. J Cereb Blood Flow Metab 1996, 16(2):311-319.