![]()
![]()
![]()
![]()
|
|
|
|
|
The List tab illustrated below is used to work with contour VOIs and define their properties.
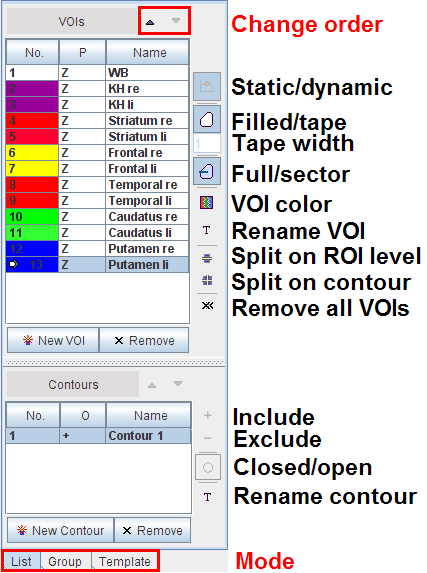
The VOIs section contains the list of defined contour VOIs, and VOIs which are in the progress of outlining. New VOI creates a new list entry, with the plane direction P according to the currently selected plane (Z = axial for all VOIs in the example above). The selected VOI can be removed using the Remove button. The arrow buttons on top of the list allow changing the location of the selected VOI in the list.
VOI Properties
In addition to the plane orientation a VOI has several properties, which can be changed by the buttons to the right of the list. They have the following meaning.
Toggle |
Static VOI Dynamic VOI |
Toggle |
Filled VOI Tape VOI |
Toggle |
Full VOI Sector VOI |
|
Color Palette. Allows changing the contour line color. All contours belonging to a VOI have the same color. |
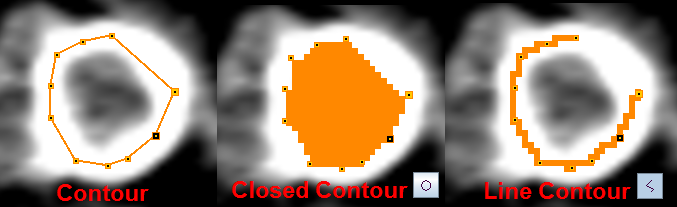
The illustration below illustrates the effect of the different properties on the pixels used for VOI statistics.
Contour Properties
The Contours section contains the list of the contours defined in the current slice for the VOI selected in the VOIs list. The arrow buttons on top of the list allow changing the location of the selected contour in the list. Each contour has properties, which can be changed with the buttons on the right of the list.
|
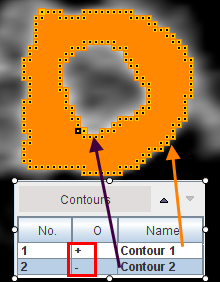
Plus Contour: This buttons sets all contours selected in the list to + in the operation column O. The meaning of a + contour is that the pixels defined by the contour are included in the statistics. This operation mode is equivalent to the OR set operation. |
|
Minus Contour: This buttons sets all contours selected in the list to -. The meaning of a - contour is that the pixels defined by the contour are excluded from the statistics. This operation mode is equivalent to the AND NOT set operation. Cardiac example illustrating how a negative inner contour can be used to create a hollow VOI.
|
Toggle |
Closed Contour Line Contour
|
Display Properties
In the lower right, there are some properties defining how the VOIs are displayed in the image overlay.
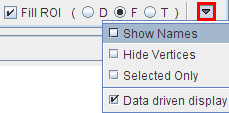
The following properties can be configured in the option menu:
Show |
Shows the VOI names next to the contours in the image overlay. |
Hide |
Removes the squares which indicate the polygon vertex locations from the image overlay, allowing a un-obstructed view of small contours. |
Selected |
Shows only the contours of the currently selected VOI to avoid confusion in the presence of multiple VOIs. |
Data driven |
Determines the behavior of the image layout when switching between different series. If the box is checked, each image has its own properties such as layout, zoom, color etc. Otherwise, the images are shown with the same layout properties. |
Usually contours are outlined on images displayed with interpolation, often combined with image zooming. In such a representation the images look smooth, even if the original pixels are big as with modalities suffering from low spatial resolution relative to the structure being outlined. To make sure that the right pixels are included in the VOI it is recommended - especially for small structures - to examine the VOI pixels as follows:

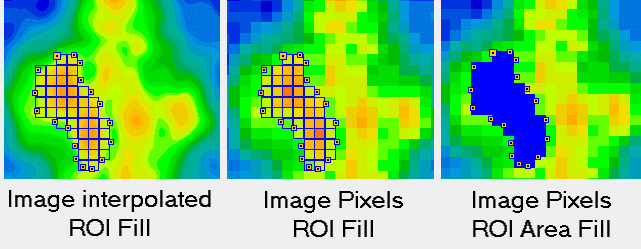
Note: PMOD only considers the entire pixels for the statistics calculation which are visualized with the Fill ROI functionality.
 /
/
 /
/
 /
/


 /
/