![]()
![]()
![]()
![]()
|
|
|
|
|
The MRTM0 reference model approach of Ichise et al. [20] is based on the Logan plot and applies for receptor studies. The assumption is, that there is a reference TAC C'(t) from a region without receptors (k3=0 in the 2-Tissue compartment model), and a TAC C(t) from a receptor-rich region (k3>0). If the Logan plot is applied for both TACs, then the input curve can be eliminated and the following multi-linear expression be found.
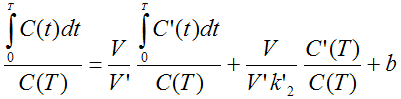
V and V' are the total distribution volumes of C(t) and C'(t), k'2 is the clearance rate constant from the reference region to plasma, and b is the intercept term, which becomes constant for T > t*.
The multi-linear relationship above can be solved using multi-linear regression, yielding three regression coefficients. From the first coefficient the binding potential can be calculated by
![]()
assuming that the non-displaceable distribution volumes in the tissue and reference regions are identical.
For radioligands with 1-tissue kinetics such as [11C]DASB the multi-linear equation is correct from T = 0, i.e., t* = 0, and b is equal to (-1/k2 ), where k2 is the clearance rate constant from the tissue to plasma. Furthermore, R1 = K1/K'1, the relative radioligand delivery, can be calculated from the ratio of the second and third regression coefficients.
Implementation Notes
After switching to the Ichise NonInvasive MRTM0 in PKIN a suitable reference region must be selected. It allows to fit a multilinear regression within a range defined by the parameters Start Lin. and End Lin. The results are the three regression coefficients, and the derived binding potential BP.
There is also an error criterion Max Err. to fit Start Lin. For instance, if Max Err. is set to 10% and the fit box of Start Lin. is checked, the model searches the earliest sample so that the deviation between the regression and all measurements is less than 10%. Samples earlier than the Start Lin. time are disregarded for regression and thus painted in gray.
Abstract [20]
"Iodine-123-iodobenzofuran (IBF) is a potent dopamine D2 receptor ligand suited for quantitative receptor studies. The purpose of this study was to evaluate three noninvasive methods of estimating the receptor parameter k3/k4 in humans with IBF-SPECT. METHODS: Scans were acquired every 5 min for 180 min using a triple-headed SPECT system following a bolus injection of IBF (296 +/- 37 MBq) in 14 normal volunteers. k3/k4 was estimated by the peak equilibrium ratio (RPE) method and two proposed methods: a variation of the graphic method that derives the ratio of ligand distribution volumes (RV) and area ratio (RA) method, in which the ratio is calculated from the areas under the specific binding and nondisplaceable activity curves. RESULTS: The mean RPE, RV and RA were 2.74 +/- 0.40, 3.06 +/- 0.42 and 2.26 +/- 0.28, respectively. Both RPE and RA underestimated RV. The relationship between RPE or RA and RV was linear (p < or = 10(-5), RA showed higher correlation (r = 0.94) with RV than did RPE (r = 0.90). Simulations based on a tracer kinetic model showed that RV, unlike RPE or RA, is affected by neither regional cerebral blood flow (rCBF) nor peripheral clearance rate (CR) of IBF. All three measures showed a significant decline with increasing age (r = 0.54-0.58, p < 0.05). CONCLUSION: RV is preferred because it provides a theoretically valid estimate of k3/k4 , independently of rCBF or CR. Alternatively, RA might be preferred to RPE because the former is simpler than the latter to implement yet the former provides a measure that equally well correlates with k3/k4 ."
Note: please see also Ichise et al. [33] for explanations and the notation.