![]()
![]()
![]()
![]()
|
|
|
|
|
When a compartment system has equilibrated, the total distribution volume can be calculated easily as the ratio of tracer concentration in tissue to the metabolite-corrected plasma concentration with a single static scan. It has been found that the time required to reach equilibrium can be shortened by an optimized tracer delivery. A setup which does not require a sophisticated tracer delivery system is to apply an initial bolus and continue with a constant infusion.
Carson et al. [23] have developed a method to optimize the ratio between the activity given as the initial bolus and the activity level of the subsequent infusion for quickly reaching an equilibrium (Appendix B in [23]). It is assumed that tissue TACs as well as the input curve have been measured beforehand in a bolus experiment. Ideally then, the measured activities represent the impulse response of the system. Under this assumption it is possible to calculate the tissue response for any given input curve by just convolving the TACs with the input curve. For a bolus and infusion (B/I) experiment the input function can be described as an initial impulse followed by a step function, and the convolution can be analytically solved as
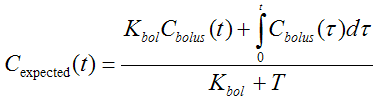
Kbol [min] defines the contribution of the bolus in minutes of infusion, and T is the total duration of the infusion (end of last frame).
Implementation Notes
It is assumed that the data of a bolus study has been loaded. When the Bolus/Infusion Opt model is selected, the expected tissue activity according to the formula above is calculated using the default parameters, and shown as the model curve.
Kbol can be estimated. The user has to enter a reasonable equilibration time as the input parameter Start Equilibr. When Fit current region is activated, the optimal Kbol is calculated. The criterion for an equilibrium is that the calculated activities from Start Equilibr on are as constant as possible. Also, please note the following:
Abstract [23]
"Positron emission tomography studies with the opiate antagonist [18F]cyclofoxy ([18F]CF) were performed in baboons. Bolus injection studies demonstrated initial uptake dependent on blood flow. The late uptake showed highest binding in caudate nuclei, amygdala, thalamus, and brainstem and the least accumulation in cerebellum. By 60 min postinjection, regional brain radioactivity cleared at the same rate as metabolite- corrected plasma, i.e., transient equilibrium was achieved. Compartmental modeling methods were applied to time- activity curves from brain and metabolite-corrected plasma. Individual rate constants were estimated with poor precision. The model estimate of the total volume of distribution (VT), representing the ratio of tissue radioactivity to metabolite-corrected plasma at equilibrium, was reliably determined. The apparent volume of distribution (Va), the concentration ratio of tissue to metabolite-corrected plasma during transient equilibrium, was compared with the fitted VT values to determine if single-scan methods could provide accurate receptor measurements. Va significantly overestimated VT and produced artificially high image contrast. These differences were predicted by compartment model theory and were caused by a plasma clearance rate that was close to the slowest tissue clearance rate. To develop a simple method to measure VT, an infusion protocol consisting of bolus plus continuous infusion (B/I) of CF was designed and applied in a separate set of studies. The Va values from the B/I studies agreed with the VT values from both B/I and bolus studies. This infusion approach can produce accurate receptor measurements and has the potential to shorten scan time and simplify the acquisition and processing of scan and blood data."