![]()
![]()
![]()
|
|
|
|
The PMOD kinetic modeling tool represents a flexible environment for the simulation and fitting of models over time. While initially aimed at the compartment models employed in Positron Emission Tomography (PET) and Single Photon Emission Computed Tomography (SPECT), models for other modalities such as magnetic resonance or optical imaging can also be easily incorporated due to the general approach and the plug-in structure for the models.
PKIN incorporates the following features:
Starting the Kinetic Modeling Tool
The kinetic modeling tool is started with the Kinetic button from the PMOD toolbar

or by directly dragging kinetic modeling (.km) files onto the above button.
The user interface is organized as shown below. The left part of the display visualizes the data, the model and the fit. The green squares represent the tissue measurement values (tissue time-activity curve, TAC), the red squares the input curve, the yellow squares the blood spillover curve (whole blood time-activity curve), and the blue circles the calculated model curve with the current model configuration shown to the right. The lower curve display shows the unweighted residuals between the measurement and the model curve.
The right part gives access to the different operations which are described in the following sections.
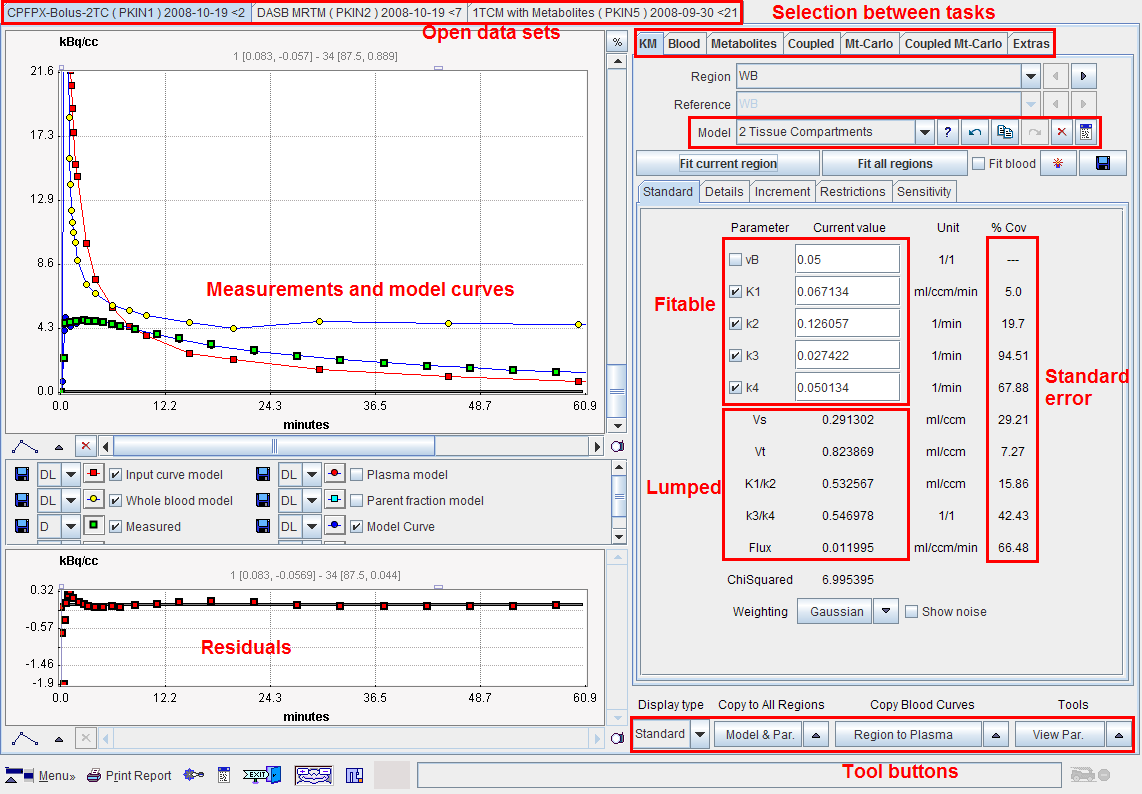
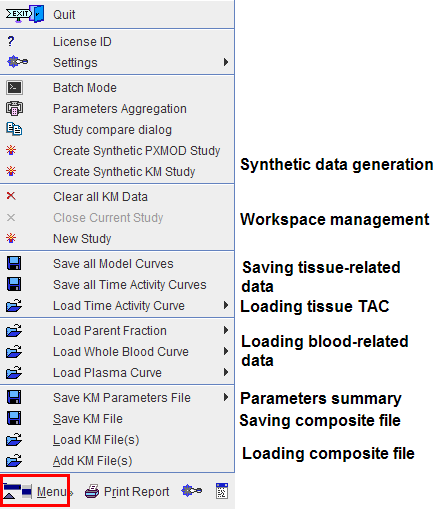
The Menu is located in the lower left corner and is used for data operations such as loading, saving or closing.
Loaded data sets can be added into new tabs, so multiple data sets can be available simultaneously and selected for processing using the named tabs.