The same image display object is used in all PMOD tools. It consists of an image viewport, ie. the black area for the images, a set of image presentation and layout controls to the upper right of the viewport, and some tools grouped along the image.
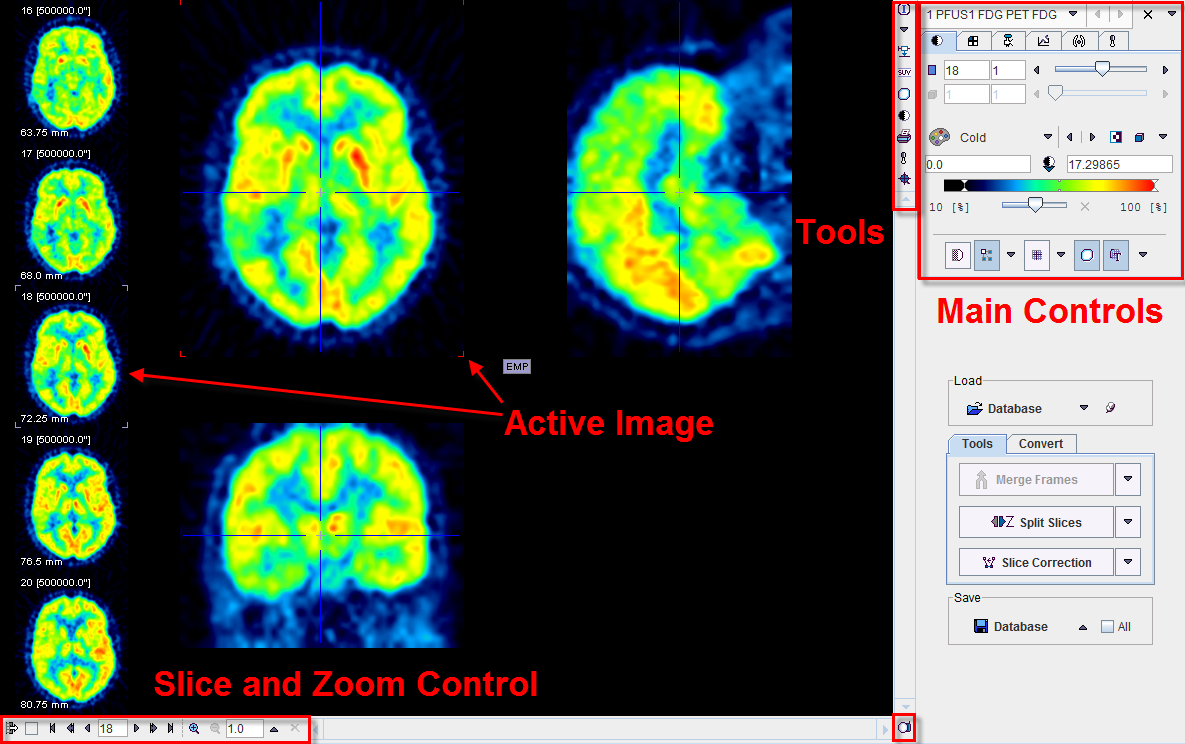
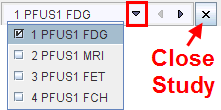
The viewport shows one or several images of a series, depending on the image layout which can be modified by use of controls. Most PMOD tools allow for loading more than one image series. The image display may then be switched between the available series with the selection at the top of the controls, eg.
There are two arrays of buttons next to the images themselves. The vertical row in the upper right presents auxiliary tools for inspecting the image data currently displayed. Their functions are:
|
Shows information related to the displayed image series and also allows changing timing and patient/study information. |
|
Selection between the stacked image series. |
|
Start the Data Inspector to examine the pixel values, time vectors of dynamic studies, the acquisition times, standard uptake values (SUV), and the origin. |
|
Start the SUV page of the data inspector directly. |
|
Start the Volume-of-Interest tool to outline VOIs and calculate statistics on the currently shown images. |
|
Start the Large View tool which allows looking at the same images but in a maximized viewport. |
|
Button to hide/show the image controls. Hiding the controls after the images are in a suitable presentation has the advantage of a larger viewing area. |
|
Generate a Report for printing or saving. |
|
Activate the mouse-operated zooming mode. |
|
Show the external tools list. |
The horizontal button row in the lower left embodies the following functions (starting from the left):
|
This toggle button enables/disables the preview of slices neighboring the active one along the left side of the image viewport (in 1x1 and orthogonal layouts only). |
|
This box is only functional for dynamic studies. In this case the user can select between stepping through the slices at a certain time (no check), or through the times for a fixed slice (check). |
|
Buttons to step backward/forward in increments of an slice or a page (for multi-image layouts), or to jump to the begin/end. Entering a number allows positioning the display immediately. Note that slice scrolling can also be done using the mouse wheel. |
|
Buttons for zooming and resetting the zoom. The sliders appearing in zoom mode below/besides the image allow positioning the zoomed images. |
The image presentation can be modified in many ways by means of the control panels, which can be brought forward by clicking on the corresponding tab. Note that depending on the context some of the panels (e.g. oblique reslicing) and buttons may be missing.