![]()
![]()
![]()
![]()
|
|
|
|
|
Variable Selection
The ![]() button activates the Table layout for inspecting the data in the R workspace. The R variables can be selected from the Preview list indicated below.
button activates the Table layout for inspecting the data in the R workspace. The R variables can be selected from the Preview list indicated below.

The list will show the original variables as well as variables created by the scripts and R commands.
Table View Layout
After selecting a variable, its content can be inspected. The default 2D view illustrated below shows the table of the data frame.
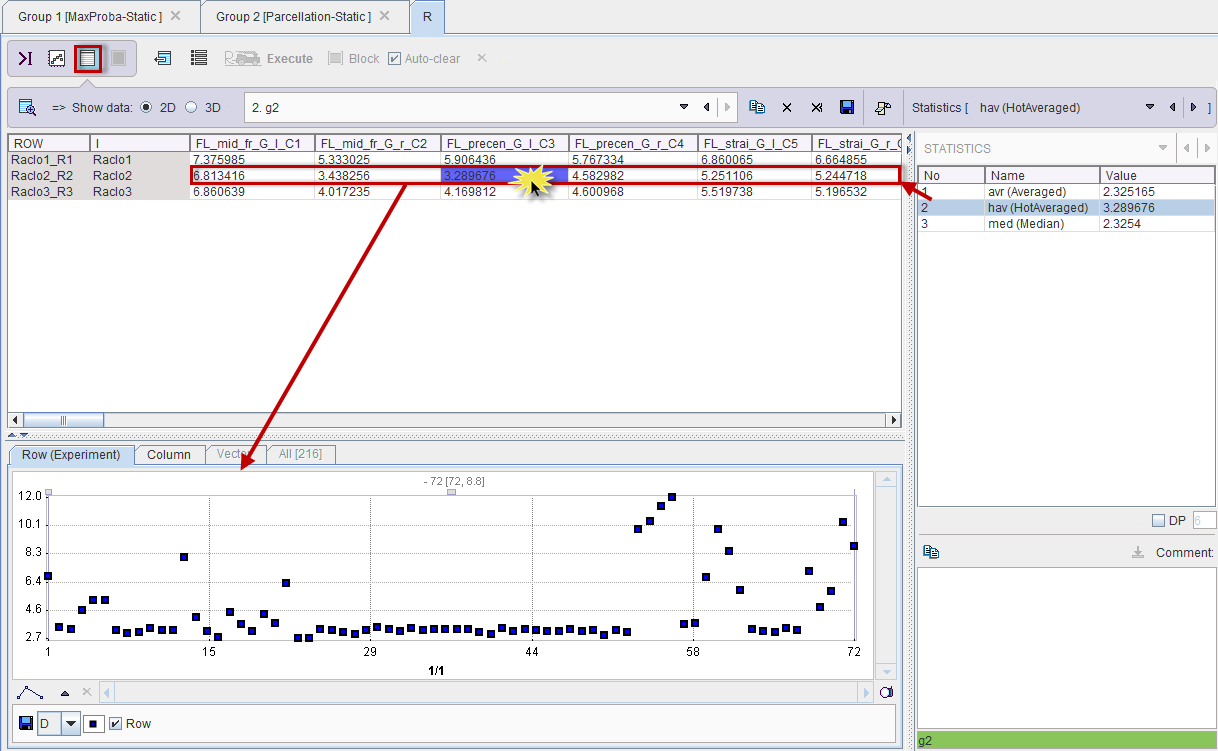
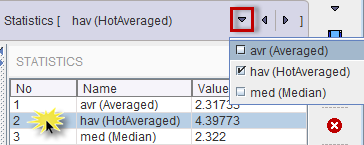
The lower plot area shows scatter plots of a data Row or Column. One variable may have different data frames for different aggregated outcome statistics such as avr, hav, and med. The Statistics selection can be used to change between statistics, as well as direct double-clicking into the Statistics list.
In order to keep track of the variable meaning, comments can be added in the lower right. Please select the variable of interest, enter the comment, and then activate the copy button illustrated below. When saving the R workspace, this comment will be included, so that it will be available when resuming work.
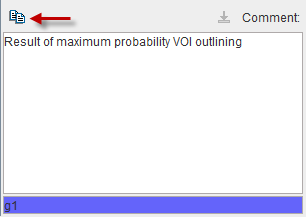
Table Buffer
Note that each visualization of a table is stored in a buffer list so that it can be quickly recalled. While a variable exists only once, there might be multiple entries in the buffer which may represent the visualization of different variable parts.

The buffer list can be edited with the buttons to its right:
|
Remove current table from the list. |
|
Save all tables into a file. |
|
Copy the current table to the clipboard. |
|
Clear the buffer list. |
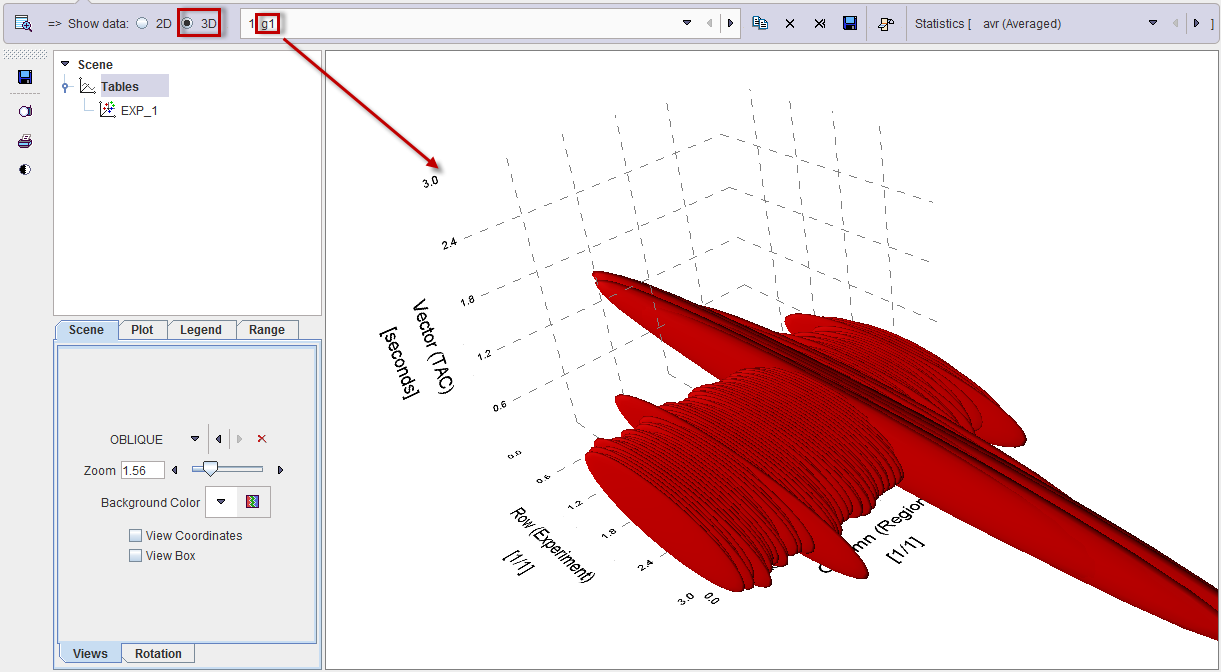
Surface Plot Visualization (Option)
The tables from the buffer can also be visualized as 3D surfaces as illustrated below.
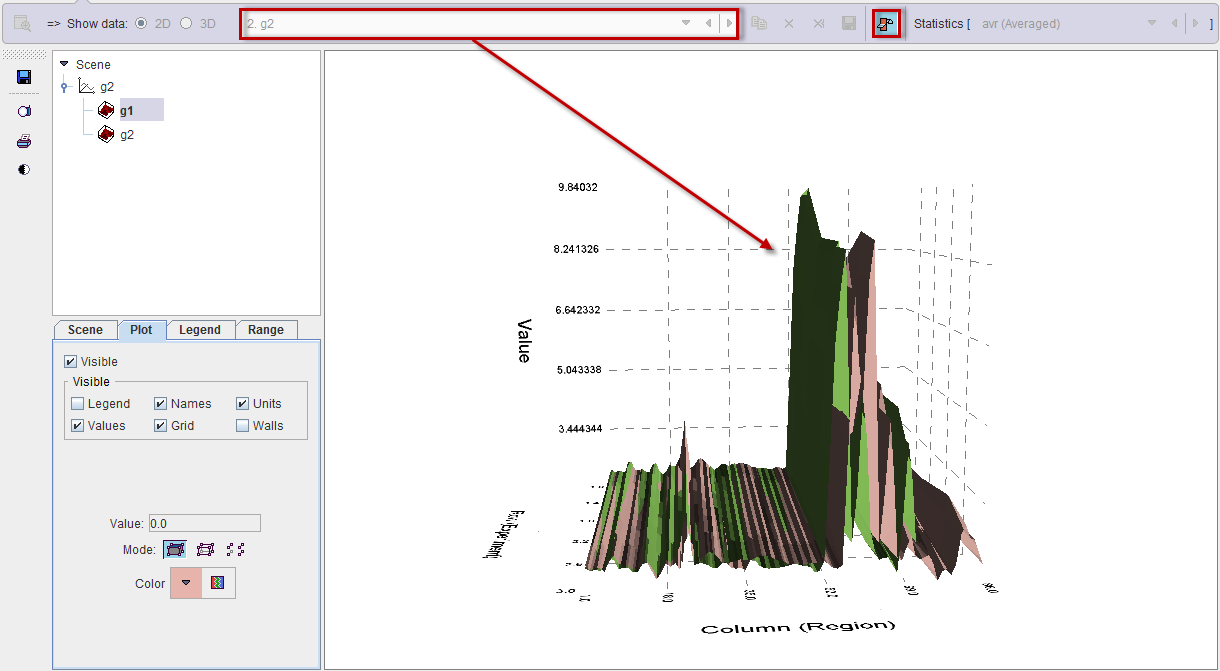
It is essential, that before enabling this display the buffer is prepared so that only meaningful tables remain. Please remove the other tables with the x button. For information about the 3D rendering please refer to the PMOD 3D Rendering User's Guide.
3D Visualization (Option)
When the 3D radio button is enabled, the selected buffer table is displayed as shown below.
Dynamic Data
If the loaded statistic has a time dimension, the table represents the values at a certain time which can be selected in the TIME VECTOR list or by moving the Sample slider.
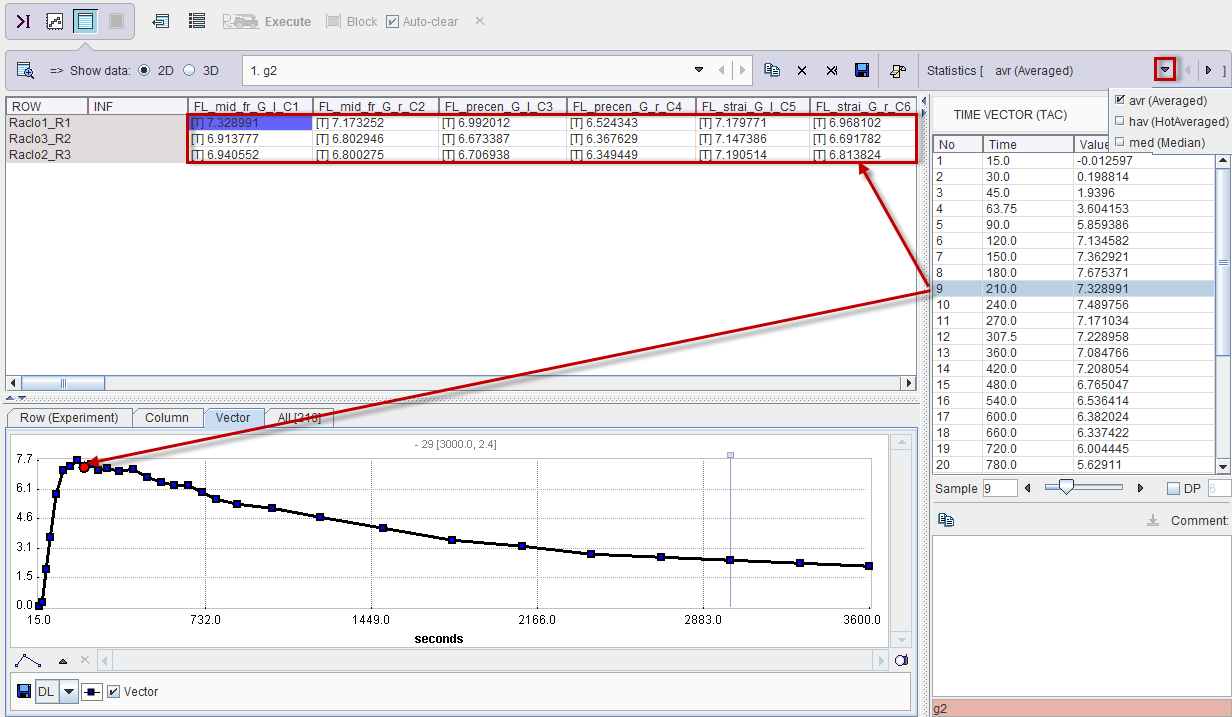
The TAC corresponding to the selected cell (subject/VOI) and the selected Statistics is plotted in the Vector tab, and all TACs in the All tab.

