![]()
![]()
![]()
![]()
|
|
|
|
|
The data inspector tool is opened using the button

and initially shows the dialog window illustrated below.
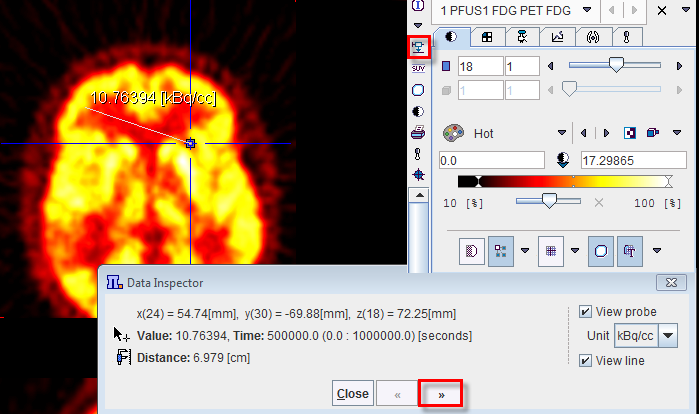
When the cursor is moved over the images, the information about the cursor location (in pixels, and mm from the coordinate system origin) and the pixel value at that location is continuously updated. A locator is shown in the image, marking the last position where the left mouse button was clicked into the image. The distance from the locator to the current cursor position is continuously updated. If the View line box is checked, a line indicates the measured distance. If the View probe box is checked, the pixel value is also shown close to the cursor and the units displayed. If the SUV option is selected in the Unit list while View probe box is enabled, the SUV [g/ml] is automatically calculated and displayed for each pixel. Note that in order to calculated the SUV, the patient weight and size as well as the injected dose are requested.
The >> button extends the dialog window to show more information

Using the TAC tab the time-activity curve of single pixels can be inspected (for dynamic studies only) and sent to the kinetic modeling tool. It gets updated as soon as the user clicks at a pixel.
The Profiles tab displays the horizontal and vertical profiles at the current location of the locator.
On the 3D plot & histogram tab a 3D plot and the histogram of the slice values are shown, whereas the SUV tab allows to inspect the pixel values in SUV rather than kBq/cc, provided that all activity information is available. The SUV tab is explained in the next section.