![]()
![]()
![]()
![]()
|
|
|
|
|
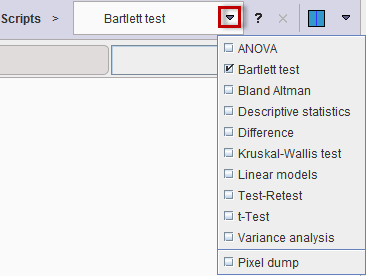
PMOD has developed several scripts to support users with the statistical analysis of results arising in the comparison of populations or analysis methods. To use them efficiently, the outcome measures should be organized in groups by aggregation.
For example, if healthy controls are studied twice to determine the repeatability of an acquisition/data processing methodology, the results of the first study should be aggregated in a test group g1, and the results of the second study in a retest group g2. These groups can then be loaded into the R-console of PMOD, and analyzed with the Test-Retest script.
Another typical example is the comparison of analysis methods. The same set of population data will be processed twice with different methods, for instance to calculate the regional binding potential BPnd. All BPnd estimates resulting from method 1 are aggregated into a group g1, and all BPnd estimates resulting from method 2 in group g2. The method comparison is then done by applying the script Bland Altman Plot to g1 and g2.
The scripts generate and execute native R code which can be inspected in the command console and serve as a basis for users to develop their own, modified scripts.
Invoking Scripts
After loading the data to be analyzed, scripts can be called either from the Scripts list of the command layout
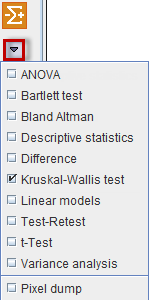
or via the lateral taskbar by the indicated arrow button
The following sections describe each of the scripts. Most practical details are included in the Descriptive Statistics section, so please make sure to read this section first.