![]()
![]()
![]()
![]()
|
|
|
|
|
The interface of the batch pipeline tool is illustrated below.
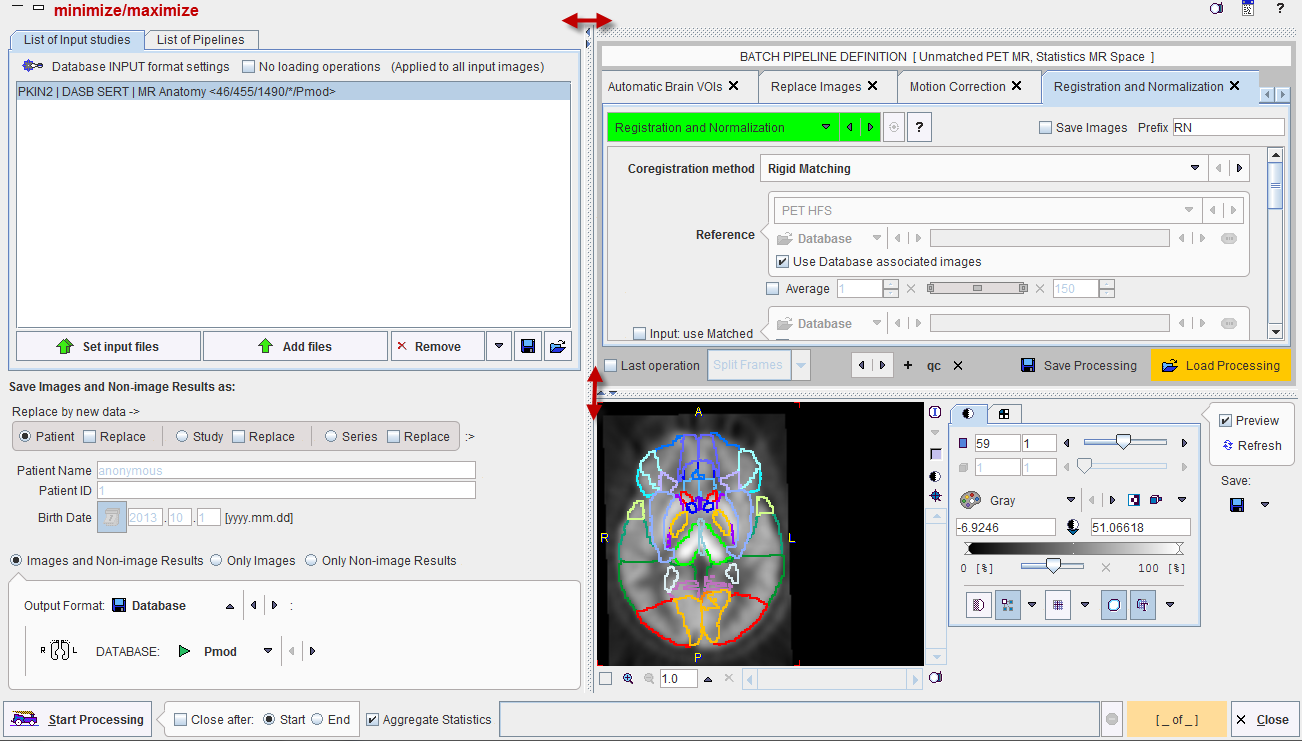
The window has four areas, which are described below. Note the divider buttons  and
and ![]() which can be used for enlarging/reducing the relative areas. The modal window can't be closed, but it can be reduced in size by the button in the upper left. The upper right provides buttons for taking a screen capture, showing the console window, and opening the help information.
which can be used for enlarging/reducing the relative areas. The modal window can't be closed, but it can be reduced in size by the button in the upper left. The upper right provides buttons for taking a screen capture, showing the console window, and opening the help information.
Data to be Processed
Input data specification is in the upper left. While the data format has already been specified, operations during the image loading can be configured with the INPUT format settings button. For instance, smoothing filters can be applied, or data interpolated to a certain (e.g. isotropic) pixel size. Another candidate operation is Reorient to Standard Orientation, which brings the images at loading time into the radiological standard HFS orientation. Note that all images will undergo these operations, also secondary images specified in the pipeline tools. The box No loading operations can be used for ruling out any data transformations.
The images to be processed are defined by the Set input files or Add files buttons, which open a dialog window for selecting image files. 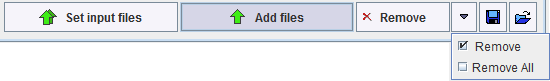
The data selections build up the data list for processing. While Remove deletes a selected entry from the list, Remove all clears the whole list. An input data list can be saved for later use with the button right to Remove.
Processing Definition
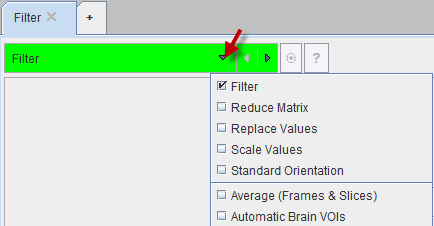
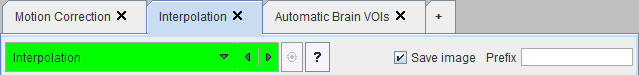
The processing pipeline is configured in the upper right area. Each processing stage is added as a tab, with processing working from the left towards the right. Tabs can be appended using the + tab, and removed by the x in its tab. The tool to be applied is selected from the list selection on the tab indicated below. Note that some entries in the list are labeled by (pipeline only) to indicate they are not available in other contexts.
A selected tool shows its parameters on the lower part of the tab for configuration.
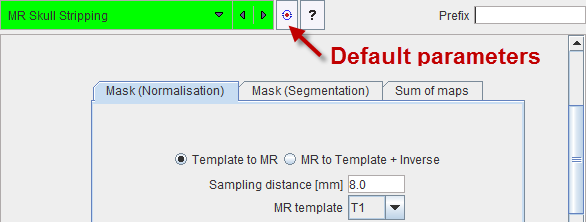
Right to the tool selection there is a button for setting the parameters to the tool default values, and a ? for showing help information about the tool. The Prefix string can be used to tag the images and non-image results produce by the tool.
Below the parameter are there are some convenience buttons.
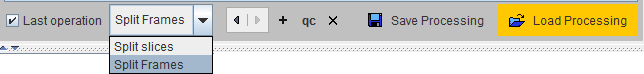
The Last operation box is relevant, if the resulting images should be split into individual frames, or even slices. The left/right arrows are a shortcut to select the previous/next tab for fast browsing. The + button adds a new tab before the selected tab, and x removes the selected tab. Save Processing and Load Processing allow saving/retrieving a pipeline definition, optionally with the list of images to process. qc adds a quality control breakpoint after the selected tab.
Processing Preview
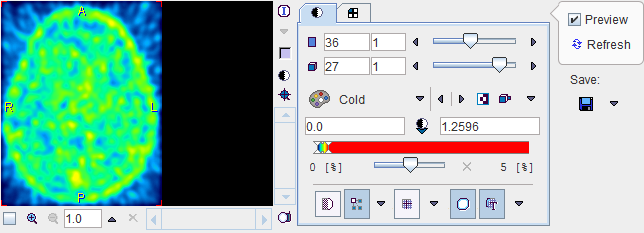
In order to verify the pipeline setup, the Preview box in the lower right can be enabled. As a consequence, the current pipeline definition is applied to the data set selected in the List of Input Studies and the result image shown. According to the results, some tool parameters may be edited and the result updated using the Refresh button. The result images can optionally be stored with the Save button.
Output configuration
A pipeline produces images, but can also result in some derived information such as VOIs, regional statistics or kinetic modeling files. The radio button in the Save Images and Non-image Results area serves for defining the information of interest: Images and Non-image Results, Only Images, and Only Non-image results.
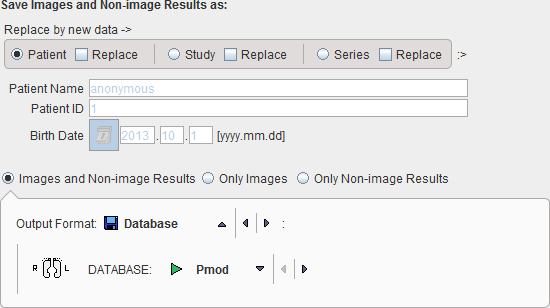
The format of the saved images is defined by the Output Format selection. Depending on the format, some parameters need to be configured, such as the output DATABASE in the example above.
With file-based formats such as NIfTI
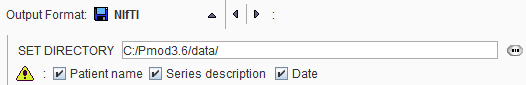
the file system path where all files will be stored needs to be defined with SET DIRECTORY. The check boxes Patient name, Series description and Date instruct the program to include these elements into the generated filenames to avoid overwriting due to non-unique file naming.
Output of Intermediate Tools
It is assumed, that the main output is produced by the last (right-most) tool in the pipeline. Therefore, its result images are always saved. The intermediate tools have a Save images box which may be enabled for saving their images too, either during pipelines setup for testing, or during production processing for later validation procedures. The Prefix string serves for meaningfully tagging the saved data. Saving of the non-image results is also tied to the Save images box, but only occurs with the general saving options Images and Non-image Results and Only Non-image results.
Processing the Data
It is recommended saving the pipeline definition first, and then activate Start Processing.

The Aggregate Statistics option is only relevant for non-image results such as regional uptakes or regional kinetic parameters. If the option is enabled, the results of all data sets are concentrated into a single aggregation table, which can immediately be used for statistical analysis. In case both regional uptakes and kinetic parameters are produced, aggregation of the kinetic parameters takes priority.
Preferably, Close after Start is enabled. In this way the dialog window is closed and the processing runs in the background. At the end of processing a dialog window is shown which indicates that processing was ok, or otherwise provides a problem report.
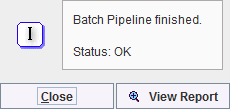
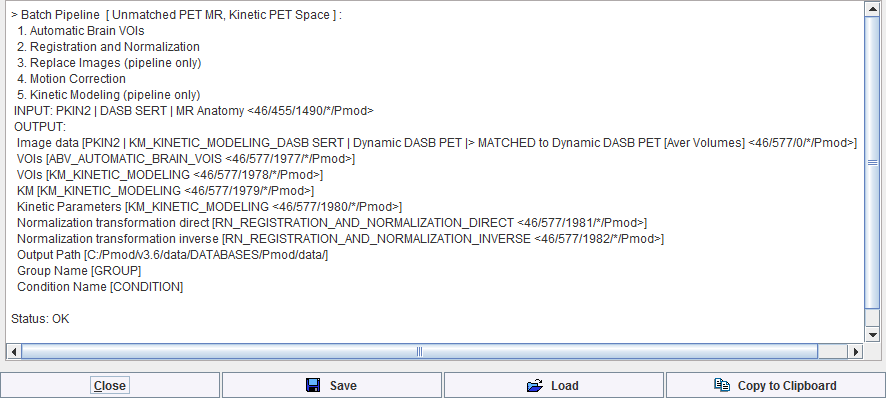
View Report provides information about the input and output of the pipeline, as well as the processing steps, as illustrated below.