Pipeline Example: Brain Uptake Statistics, MR Space
Available Data
The pipeline outlined below assumes the following available scenario: A patient had two separate scanning sessions, resulting in a dynamic brain PET and an non-matched T1-weighted MRI.
Intended Analysis
To provide a complementary example to the one above in this case the statistics is performed in the MR space, and instead of performing kinetic modeling, the PET uptake is averaged during a certain frame range.
Processing Pipeline Outline
It is assumed that the user has imported the data into a PMOD database and associated the PET and the MR series. The described analysis can then be implemented by the following pipeline sequence.
- Because the anatomical information in the MR image is better than in the PET, the MR is first loaded into the pipeline. So the MR is the Input study.
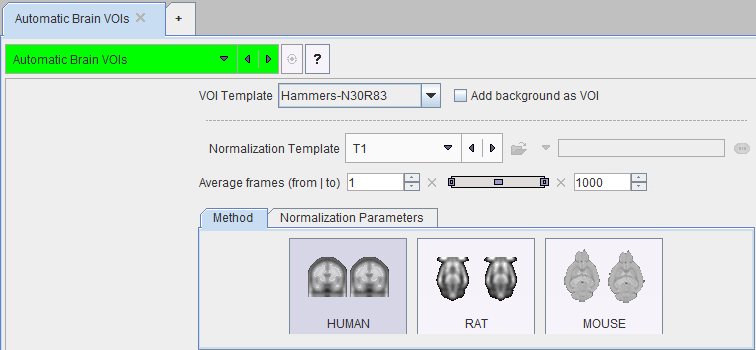
- The Automatic Brain VOIs tool is then applied. It generates the VOIs in the MR image space. These VOIs will continue existing in the following pipeline stages.
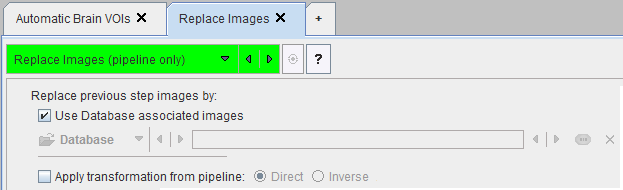
- The PET images are brought into the pipeline using the Replace Images tool which swaps the current (MR) image with its associate (PET). From now on, the associated image is the MR.
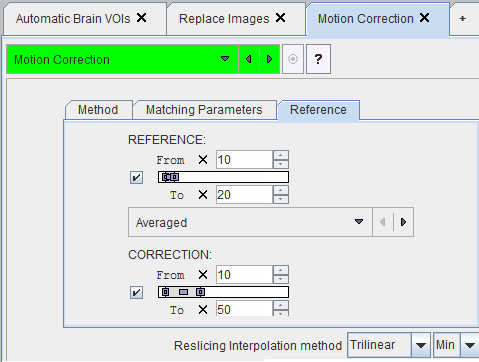
- If necessary, patient motion in the dynamic brain PET can be corrected with the Motion Correction tool. Make sure that the Averaged reference is selected. With this approach, a reference image is created by averaging the frames between From and To in the REFERENCE section. In this example a range from 10 to 20 is applied, omitting the noisy short frames at the beginning. The CORRECTION is then applied from frame 10 onward.
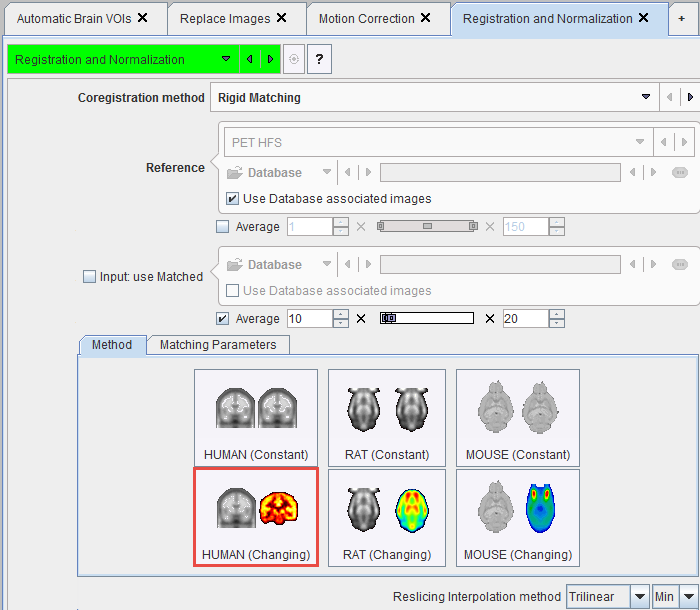
- The rigid transformation between the MR and the PET is determined using the Registration & Normalization tool. In this example the MR should serve as the reference. As PET is currently in the pipeline, this can be configured by the Use Database associated images for the Reference. For the rigid matching the average PET image between frames 10 and 20 will be used which is configured below the input section.
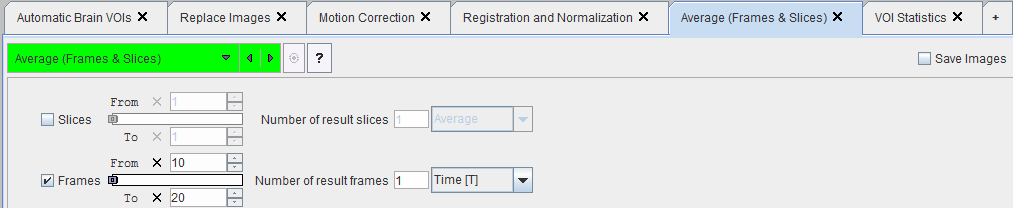
- The PET uptake is then averaged with the Average (Frames & Slices) tool within the Frames range From 10 To 20.
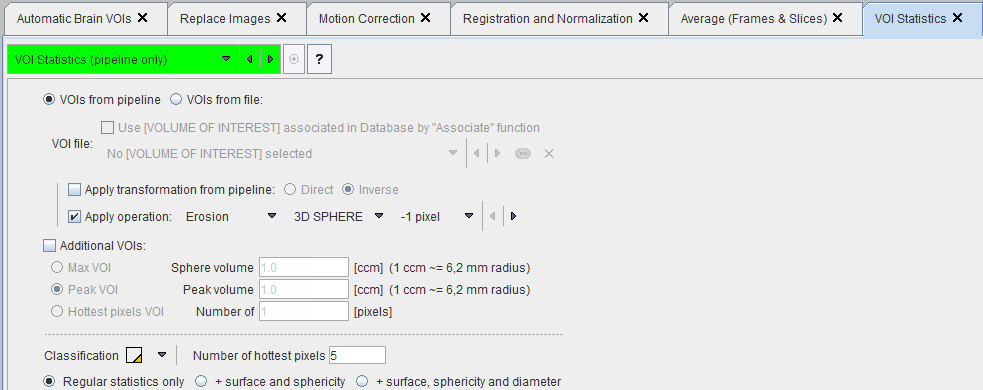
- The final step is calculation of the regional statistics. Note that the PET image has already been transformed to the MR space in the registration step, so that in this pipeline the option Apply transformation from pipeline is not required.
Required PMOD License
Note that this pipeline requires that the following modules are available in the PMOD license:
- Image fusion (PFUS): for using the Automatic Brain VOIs, Registration & Normalization, Motion Correction tools.
- Neuro tool (PNEURO): for using the Hammers atlas. However, the AAL atlas can be used alternatively if PNEURO is not available.