![]()
![]()
![]()
![]()
|
|
|
|
|
The Bland-Altman plot is aimed at comparing two measurement methods [1]. It simply plots the difference between the measurements against their average. The mean difference is the estimated bias, and from the standard deviation of the differences the 95% limits of agreement can be calculated (mean±1.96std).
Bland Altman Plot Configuration
The Bland Altman Plot script shows the following dialog window.
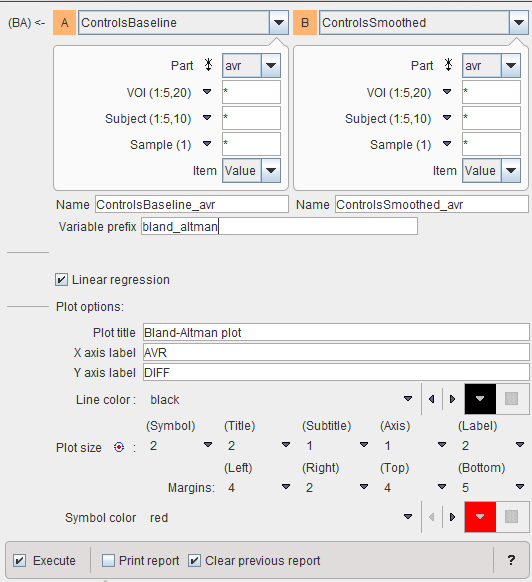
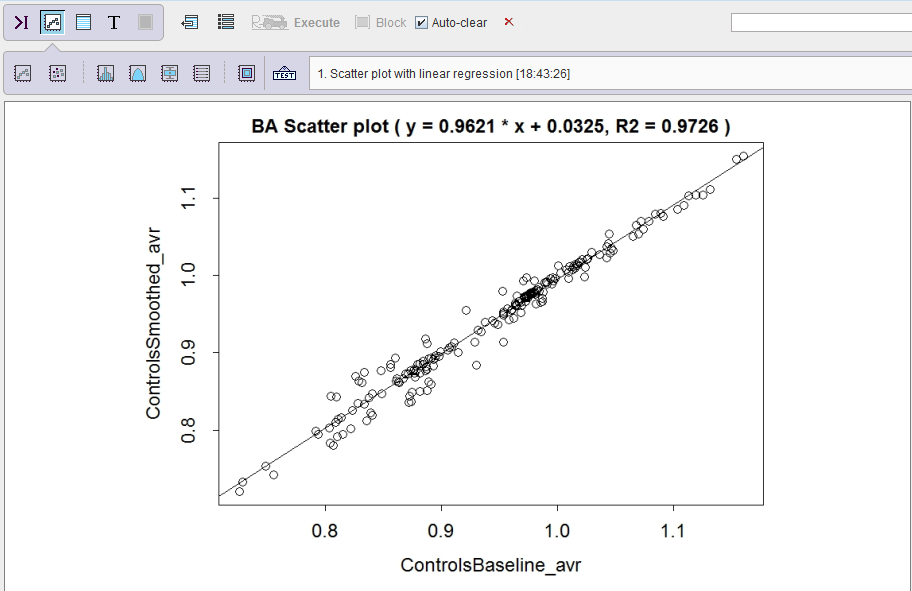
Two variables have to be defined, which will be sorted so that the correspondence between samples is ensured. The Linear regression convenience option allows getting a scatter plot with a regression line at the same time as the Bland Altman plot.
Bland Altman Plot Results
There are three numeric result tables: the data for the plot (AVR on x-axis, DIFF on y-axis) in the BA table,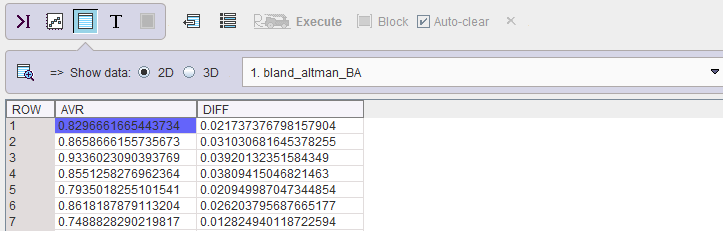
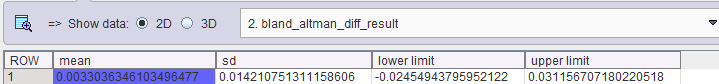
the analysis results in the diff_result table,
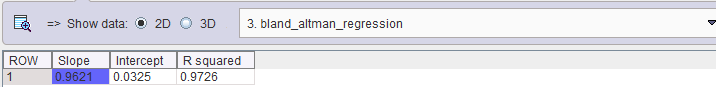
, and the equation of the linear regression in the regression table.
The corresponding plots can be inspected in the plot layout:
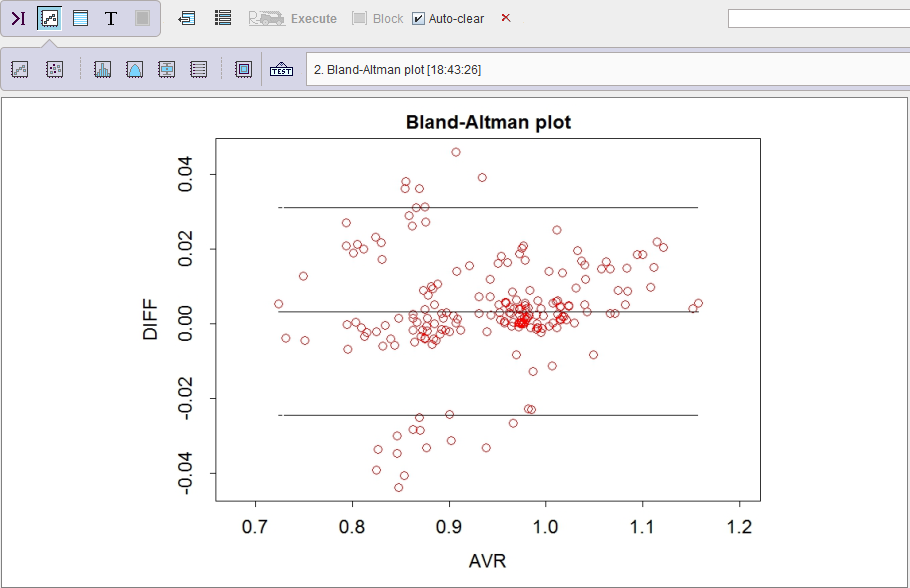
and
Reference:
1. Bland JM, Altman DG: Statistical methods for assessing agreement between two methods of clinical measurement. Lancet 1986, 1(8476):307-310.