![]()
![]()
![]()
![]()
|
|
|
|
|
The t-test is a family of statistical hypothesis tests which can be used to determine if two sets of data are significantly different from each other. An instructive summary of the background and the application of the t-test can be found on Wikipedia [1].
Depending on the application case (null hypothesis, data) a different test formula needs to be applied to the data. They all result in a t-value, which can be converted into a p-value using a table of values from Student's t-distribution.
The p-value is the probability of the obtaining at least the observed t-value, assuming that the null hypothesis is true. Therefore, if the calculated p-value is below the threshold chosen for statistical significance (usually the 0.10, the 0.05, or 0.01 level) and therefore highly unlikely, the null hypothesis is rejected in favor of the alternative hypothesis.
t-Test Configuration
The t-Test script has the configuration window below.
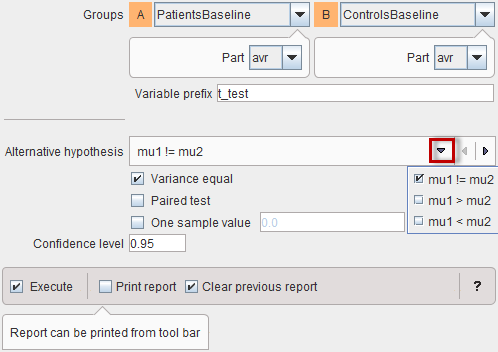
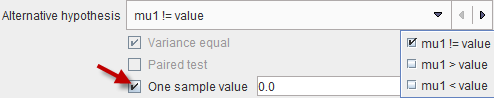
Please first define, whether a One sample location test against a specified population mean should be performed. In this case only one Group can be selected, and the hypothesis value entered. The Alternative hypotheses change to the choices below (unequal, larger or smaller than value).
Otherwise, a two-sample t-test will be performed. The two Groups to be compared need to be selected, and the appropriate Alternate hypothesis configured:
If the variance in the two samples is equal, the Variance equal box should be checked for using the pooled variance rather than an approximation. The Paired test should only be enabled if this condition is met by the two samples. In this case, the script will try to pair the group samples.
t-Test Results
The script only returns numeric results in the form of the ttest_t_results table. The example below illustrates the outcome with an unpaired two-sided test.
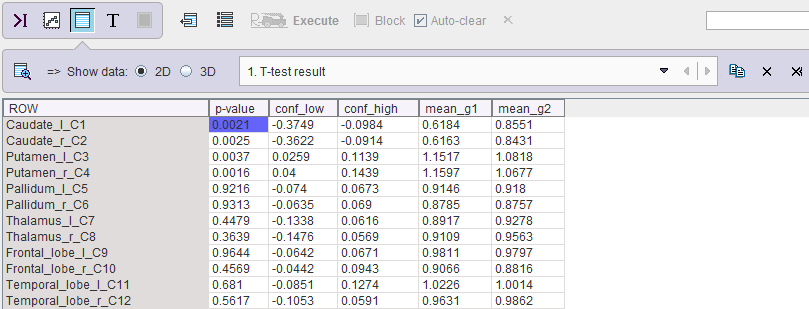
For each region the p-value, the lower and upper confidence intervals (conf_low, conf_high) as well as the two group means (mean_g1, mean_g2) are listed. In the example above, the first four regional means are significantly different, since their p-values are below 5%.