![]()
![]()
![]()
![]()
|
|
|
|
|
The Edit Data button in the Tools list brings up a dialog window which allows to examine and manipulate the TAC data of the current data set.
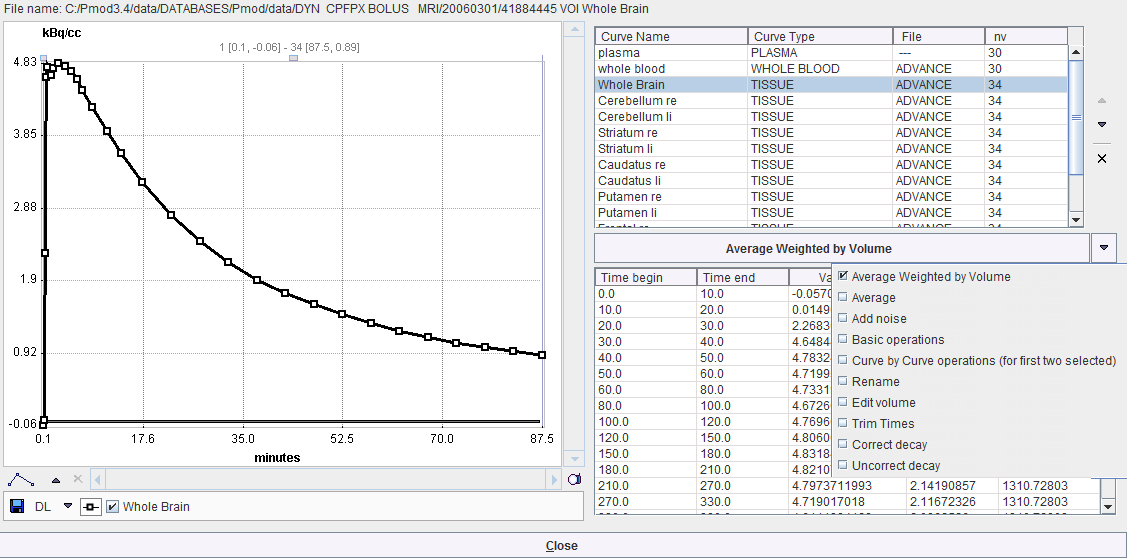
The upper section lists the different curves. The blood-related curves are at the top, then come the regional TACs. The arrows to the right can be used to change the TAC ordering, and a TAC can be removed by the x button.
The lower section lists the data of the selected curve. Shown for each sample are the acquisition start and end times, the measurement value (usually the VOI average), its standard deviation (the VOI stdv, if available), and the VOI volume. Note that the volume may vary if the VOI definition changes throughout the time course. The values of the tissue TACs can be interactively edited by clicking into a cell and changing the number.
The configuration button between the lists houses the following operations to modify TACs and generate new TACs which will be appended to the list.
Average Weighted by Volume |
When several curves are selected, this button allows calculating the volume-weighted average TAC. |
Average |
TAC averaging with equal weights. |
Add noise |
Creates a copy of the selected TACs and adds noise according to the definition defined in a dialog window. |
Basic operations |
Applies simple arithmetic operations to the values of the currently selected curves.
|
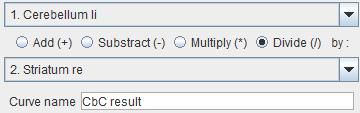
Curve by Curve operations |
Arithmetic operations between the values of two selected TACs.
|
Rename |
For renaming of the currently selected curve. |
Edit volume |
Change the volume of the selected TAC. |
Trim times |
Check for frame time overlaps of the selected TACs and correct. |
Correct decay |
Apply a decay correction to the selected TACs using the isotope of the study. |
Uncorrect decay |
Undo the effect of decay correction for the selected TACs using the isotope of the study. |