![]()
![]()
![]()
![]()
|
|
|
|
|
The kinetic modeling tool is started with the Kinetic button from the PMOD ToolBox

or by directly dragging kinetic modeling (.km) files onto the above button.
The user interface is organized as illustrated below. The left part of the display visualizes the data, the model and the fit. The green squares represent the tissue measurement values (tissue time-activity curve, TAC), the red circles the input curve, the yellow circles the blood spillover curve (whole blood time-activity curve), and the blue line the calculated model curve with the current model configuration shown to the right. All curves can be shown or hidden using the check boxes in the control area.
The lower curve display shows the weighted residuals, i.e. the difference between the measurement and the model curve multiplied by a weighting factor. Unweighted residuals can also be shown.
The right part gives access to the different models and operations which are described in the following sections.
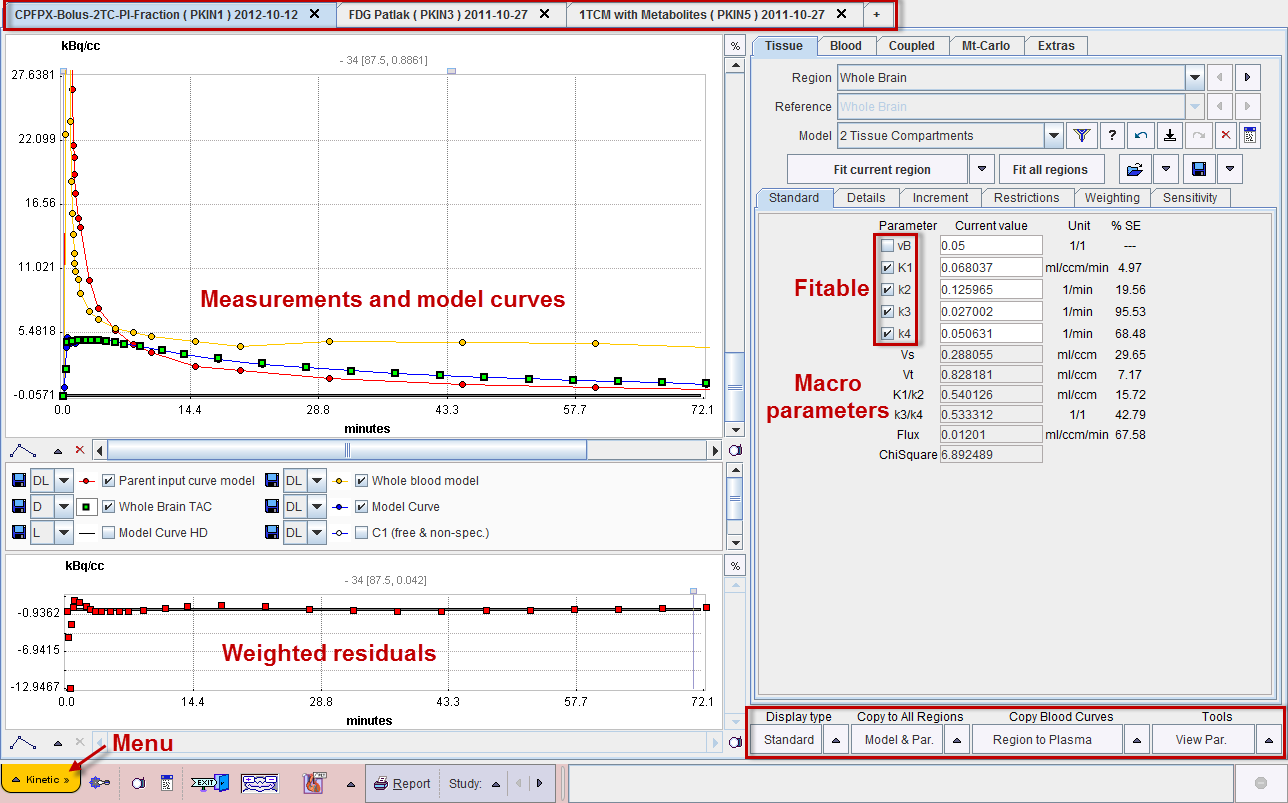
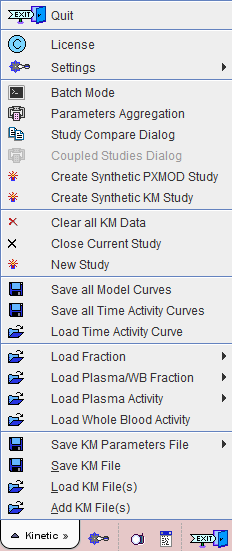
The Kinetic menu is located in the lower left corner and is used for data operations such as loading, saving or closing.
Loaded data sets can be added into new tabs, so multiple data sets can be available simultaneously and selected for processing using the named tabs.