![]()
![]()
![]()
![]()
|
|
|
|
|
The sequential steps for converting blood measurements to an input curve are explained in a dedicated section. The current plasma fraction model serves for converting a whole-blood activity curve into a plasma-activity curve.
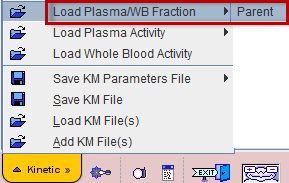
It is assumed that a curve representing the measured fractions of plasma/whole-blood activity has been loaded with Load Plasma/WB Fraction.
Operational Model Curve
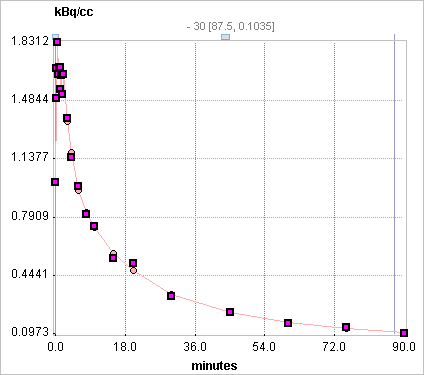
The 3 Exponentials model allows replacing the tail of the fraction curve by a fitted sum of up to three exponentials. The Begin parameter defines at what time the models switches from linear to tri-exponential interpolation. The exponentials are each defined by an Amplitude and a Halftime [min] of the decay. The number of exponentials can easily be reduced by fixing one or two of the amplitudes at a value of 0.

The illustration below shows an example with the exponentials fitted following 2 minutes (Begin = 120sec). Note that the linear interpolation assumes a fraction of 1 at t=0.
Parameter Fitting
The model supports the fitting of the parameters Begin, Amplitude 1, 2, 3 (=A1, A2, A3) and Halftime 1, 2, 3 (=T1, T2, T3). Fitting is started with the Fit plasma fraction button, which only takes the samples after the Begin time into consideration.
Appropriate default parameters for FDG scans:
Use without Measured Fraction
If no measured plasma/whole-blood fraction data is available, the 3 Exponentials model can still be applied. In this case the Begin time is disregarded, and the functional defined by the entered parameters applied.

References