![]()
![]()
![]()
![]()
|
|
|
|
|
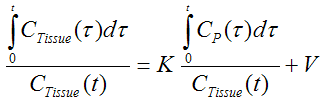
The Logan plot [19] is a graphical analysis technique developed for reversible receptor systems which allows estimating the total distribution volume Vt. The measured TAC CTissue(t) is plotted as follows using the measured and integrated plasma activity:
For suitable systems and after sufficient equilibration time this plot will approach a straight line. The slope and the intercept of the line must be interpreted according to the underlying compartment model. The slope represents the total distribution volume Vt of the tracer (including the blood space), for the 1-tissue compartment model
K = K1 / k2 + vB = Vt
and for the 2-tissue compartment model
K = K1 / k2 (1+ k3 /k4+ vB) = Vt
Implementation Notes
The Logan Plot model calculates and displays the measurements transformed as described by the formula above. It allows to fit a regression line within a range defined by the parameters Start Lin and End Lin. The results are the distribution volume (slope) and the intercept. There is also an error criterion Max Err to fit Start Lin. For instance, if Max Err is set to 10% and the fit box of Start Lin is checked, the model searches the earliest sample so that the deviation between the regression and all measurements is less than 10%. Samples earlier than the Start Lin time are disregarded for regression and thus painted in gray.
The regression line is calculated using the traditional and the perpendicular distances, resulting in the Vt and Vt_perpend, respectively. It has been found that Vt has a tendency to underestimate the distribution volume at increasing noise levels. Vt_perpend shows less bias due to noise, but suffers from a somewhat increased variability.
Standard Logan Plot, Abstract [19]
"A graphical method of analysis applicable to ligands that bind reversibly to receptors or enzymes requiring the simultaneous measurement of plasma and tissue radioactivities for multiple times after the injection of a radiolabeled tracer is presented. It is shown that there is a time t after which a plot of integral of ROI(t')dt'/ROI(t) versus integral of Cp(t')dt'/ROI(t) (where ROI and Cp are functions of time describing the variation of tissue radioactivity and plasma radioactivity, respectively) is linear with a slope that corresponds to the steady-state space of the ligand plus the plasma volume,.Vp. For a two- compartment model, the slope is given by lambda + Vp, where lambda is the partition coefficient and the intercept is -1/[kappa 2(1 + Vp/lambda)]. For a three-compartment model, the slope is lambda(1 + Bmax/Kd) + Vp and the intercept is -[1 + Bmax/Kd)/k2 + [koff(1 + Kd/Bmax)]-1) [1 + Vp/lambda(1 + Bmax/Kd)]-1 (where Bmax represents the concentration of ligand binding sites and Kd the equilibrium dissociation constant of the ligand-binding site complex, koff (k4) the ligand-binding site dissociation constant, and k2 is the transfer constant from tissue to plasma). This graphical method provides the ratio Bmax/Kd from the slope for comparison with in vitro measures of the same parameter. It also provides an easy, rapid method for comparison of the reproducibility of repeated measures in a single subject, for longitudinal or drug intervention protocols, or for comparing experimental results between subjects. Although the linearity of this plot holds when ROI/Cp is constant, it can be shown that, for many systems, linearity is effectively reached some time before this. This analysis has been applied to data from [N-methyl-11C]-(-)-cocaine ([11C]cocaine) studies in normal human volunteers and the results are compared to the standard nonlinear least- squares analysis. The calculated value of Bmax/Kd for the high-affinity binding site for cocaine is 0.62 +/- 0.20, in agreement with literature values."
Logan Plot with Perpendicular Distances in Regression, Abstract [51]
"Logan's graphical model is a robust estimation of the total distribution volume (DVt) of reversibly bound radiopharmaceuticals, but the resulting DVt values decrease with increasing noise. The authors hypothesized that the noise dependence can be reduced by a linear regression model that minimizes the sum of squared perpendicular rather than vertical (y) distances between the data points and fitted straight line. To test the new method, 15 levels of simulated noise (repeated 2,000 times) were added to synthetic tissue activity curves, calculated from two different sets of kinetic parameters. Contrary to the traditional method, there was no ( P > 0.05) or dramatically decreased noise dependence with the perpendicular model. Real dynamic 11C (+) McN5652 serotonin transporter binding data were processed either by applying Logan analysis to average counts of large areas or by averaging the Logan slopes of individual-voxel data. There were no significant differences between the parameters when the perpendicular regression method was used with both approaches. The presented experiments show that the DVt calculated from the Logan plot is much less noise dependent if the linear regression model accounts for errors in both the x and y variables, allowing fast creation of unbiased parametric images from dynamic positron-emission tomography studies."