![]()
![]()
![]()
![]()
|
|
|
|
|
After aggregation has been started, a dialog window appears with the first page 1 Select components open.
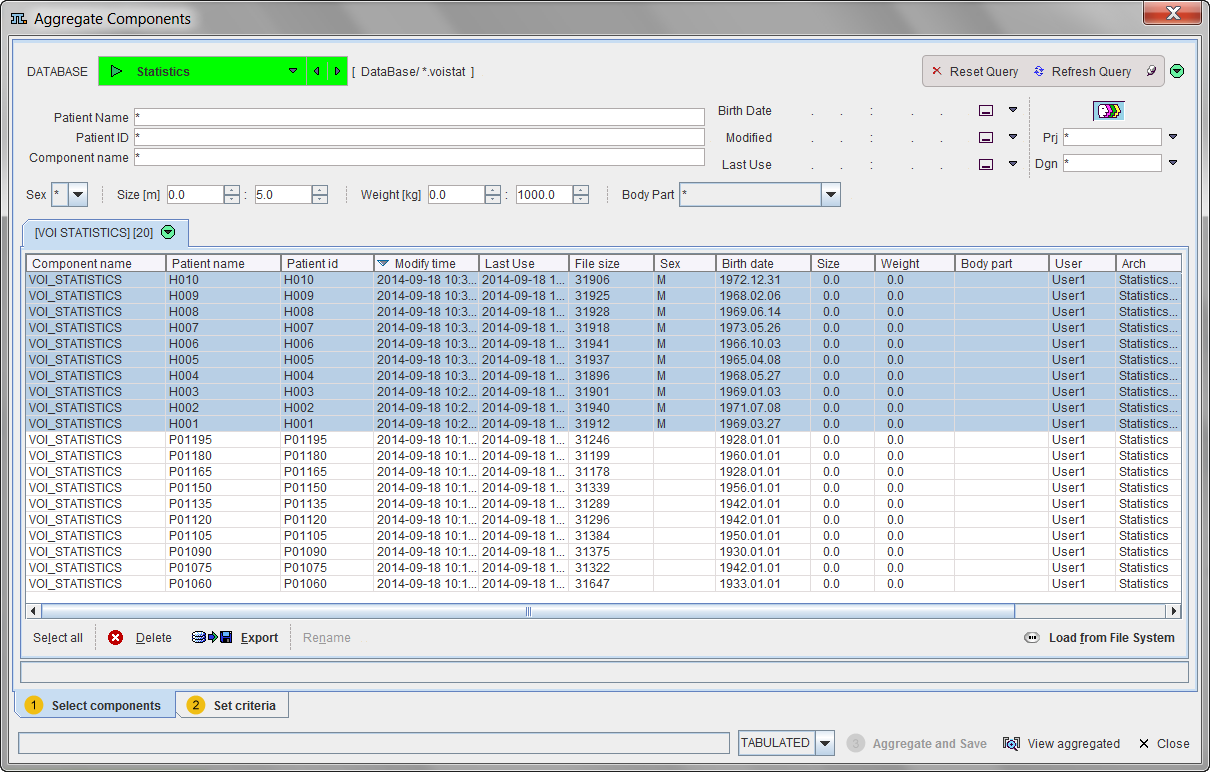
It lists all VOI statistics (.voistat files) which are available in the selected DATABASE.
The task on this page is to select the statistics components which should be concentrated into a single aggregate. This is done by selecting the appropriate entries in the list so that they appear highlighted, in the example above the ones of the healthy controls (see above). Note the filter elements in the upper part which allow reducing the number of listed components. For instance the string H* could be entered in the Patient Name field to list only the results for the controls.
If no database has been used for saving the .voistat files, the Load from File System function has to be used instead.
Select the 2 Set Criteria pane to move on to defining the information parts to be included in the aggregate.
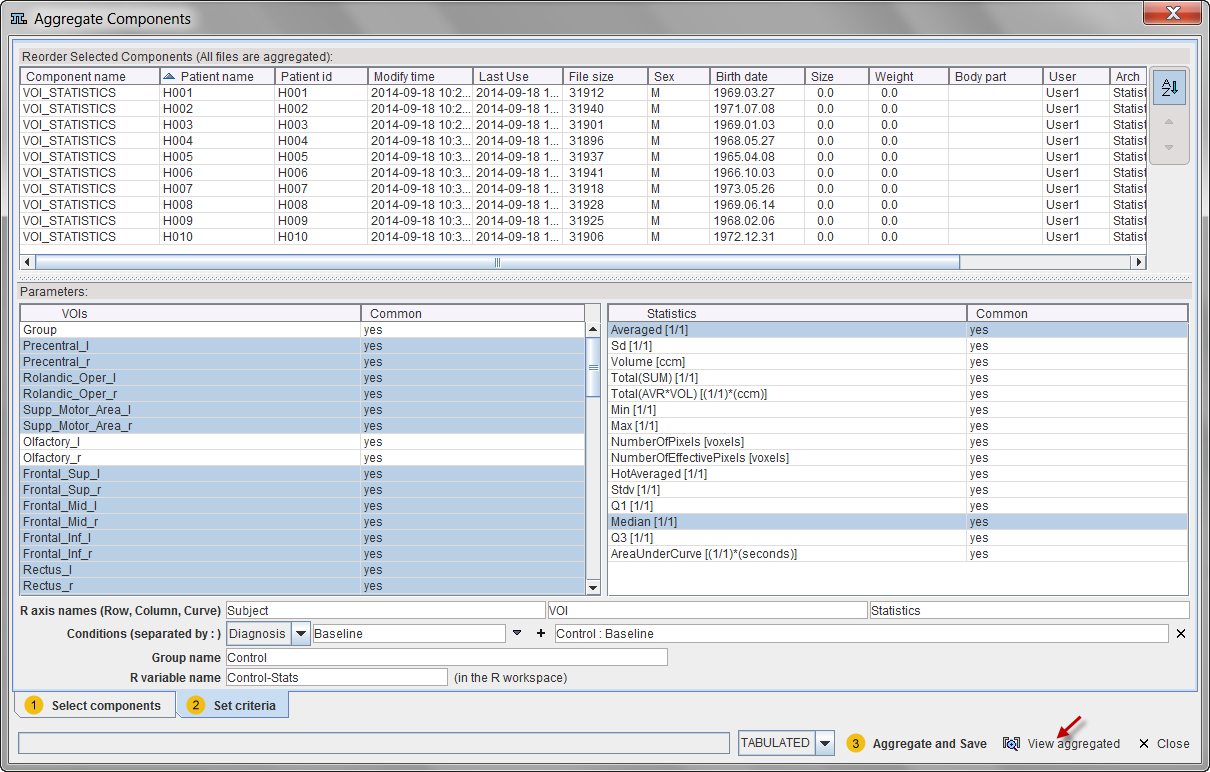
The upper list consists of the data sets selected in the prior step. This list is mainly for information. The elements can be sorted or reordered, but no entries can be removed or added.
Selection of the Aggregate Information
The lower Parameters area shows the list of VOIs used for the statistics to the left, and the calculated Statistics to the right. Note the Common column. A Yes entry indicates that the VOI/Statistics is available in all data sets. Correspondingly a No entry indicates that the information is missing in at least one of the data sets. If the information is still used despite of the No indication, a NaN value will be entered in the aggregated to signal the absence of useful information. NaN values are disregarded in the statistics script provided in the R console.
In the left list select the VOIs to be included in the aggregate, and in the right list the Statistics.
Encoding Group and Condition Information
The lower part of the window serves for providing information which will be useful when using the aggregates for statistics.
The aggregation will generate a three-dimensional data set, which will be represented in the R console as a table indexed by Row and Column, and each table element is a vector and therefore called Curve. The three R axis names fields allow defining the names of the three dimensions, which for VOI statistics default to Subject, VOI and Statistics.
The Conditions line serves for generating a code describing the current aggregate. The rational is, that the subjects of a group may be studied in different conditions, or that different types of analysis are performed.

The way to generate the condition string is to enter a string in the left field, and then activate the + button. As a result the string is appended to the current condition with a preceding " : ". Since the condition string has to be consistent among aggregates, there are two lists for generation pre-defined strings. The first list serves for choosing the condition group.

Consequently the elements of the second list are populated and can be selected.
Additional informations to be specified are the Group name, as well as the R variable name which will be useful when transferring the aggregate to the R console.
Finally the aggregate is created by the Aggregate and Save button, which enforces a saving operation.

There are two formats available, TABULATED and EXCEL. For internal use in PMOD the TABULATED format is recommended.
The aggregate can directly be transferred to the R statistics console via the Go to R button. As a result, a variable with the name specified by the R variable name will be created. To Clipboard copies the contents of the aggregate, so that it can be pasted into alternate programs such as Excel.