![]()
![]()
![]()
![]()
|
|
|
|
|
A standard task when analyzing kinetic data of a new tracer is assess the dependence of the parameters on the length of the available data. This type of analysis can easily be performed using the Data shortening option on the Extras panel. As soon as this option is enabled with a minimal data duration, the following happens when activating Fit Current region:
Results
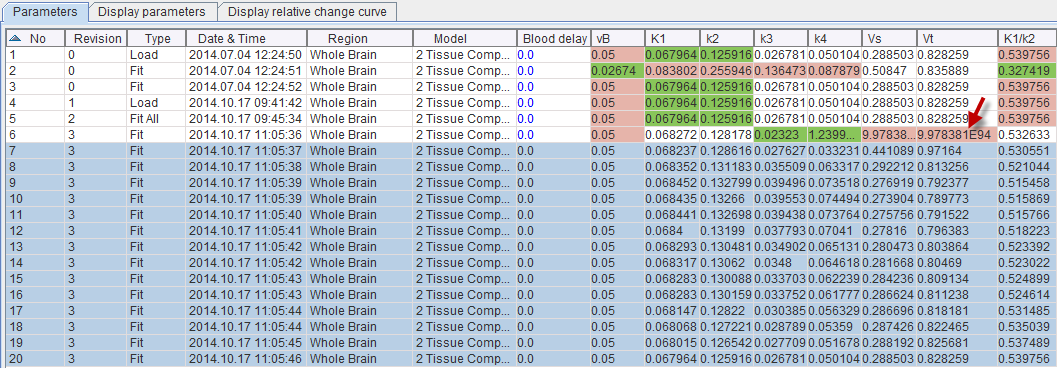
The results are stored in the model fitting history and can be opened in the with the PKIN Parameters Explorer with the  button. All fits of the sensitivity fits have the same Revision number. The data segment length is represented by the DOF column.

Sensitivity Visualization
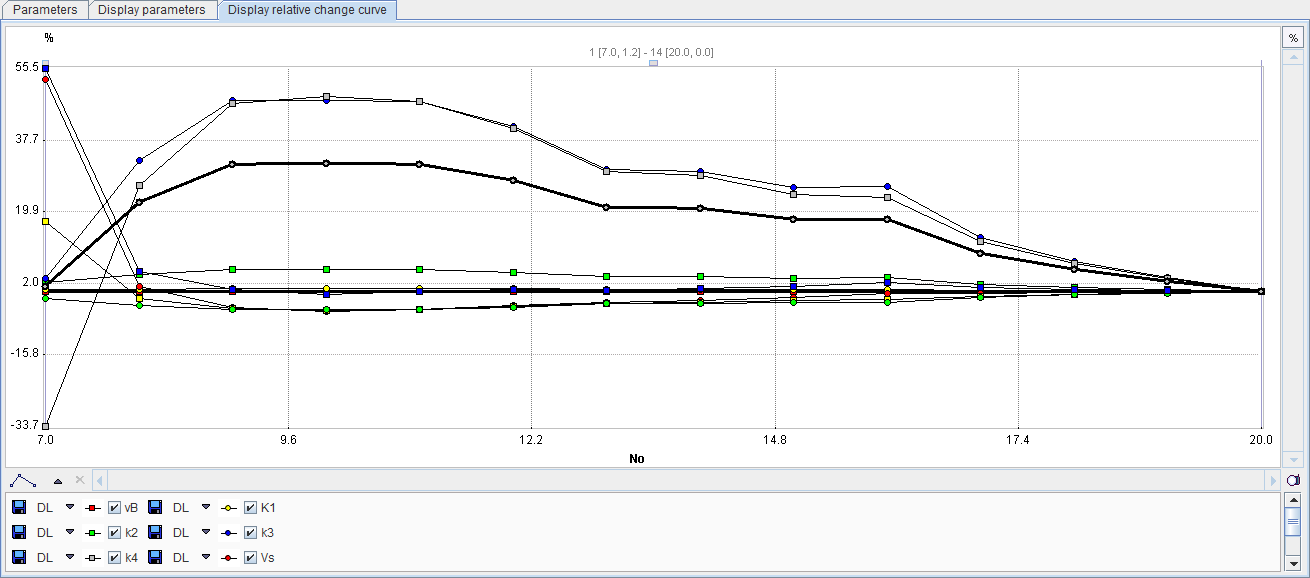
The results can be exported via Copy to Clipboard, but the trend can also directly be visualized on the Display parameters and Display relative change curve panels. The selection in the list defines the data to be visualized:
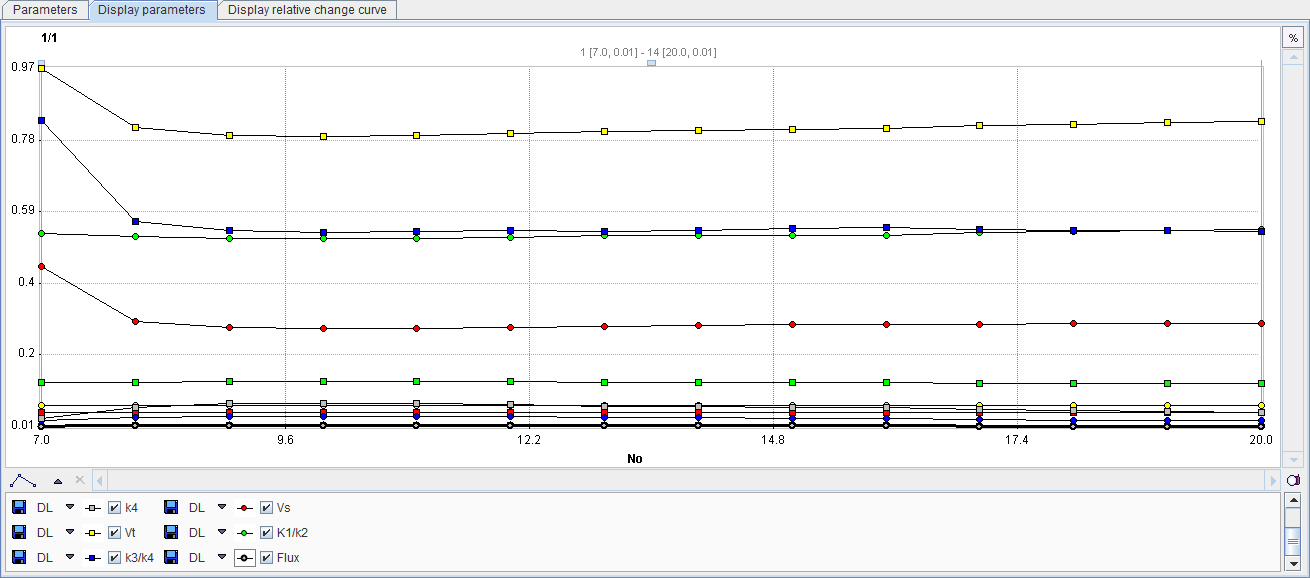
When selecting the Display parameters panel the absolute parameter values are visualized. Each parameter corresponds to a curve and can be enabled/disabled with the checkboxes in the curve control area. The x-axis value corresponds to the number in the No column, so the length of the data segment increases to the right.
When selecting the Display relative change curve panel the same curves are shown, but the values are normalized to the last point (which in the case of the sensitivity fitting can be considered as the most reliable one).