Correction and Calibration Procedure
For correcting twilite raw data and applying the current calibration factor start the Twilite Acquisition module from the PMOD ToolBox.
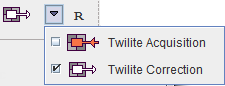
Please select the Correction page
and proceed as follows:
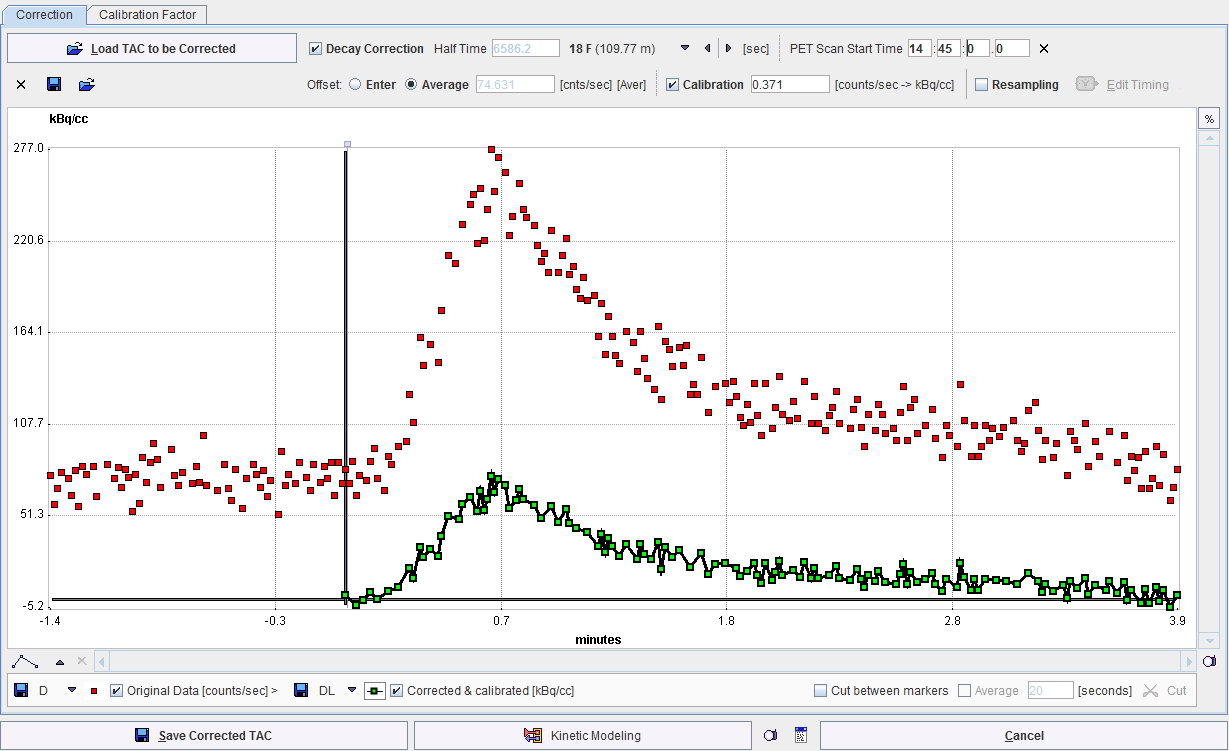
- Load the raw data of the twilite experiment with the Load TAC to be Corrected button. The coincidence rate during the measurement is displayed in the curve area as Original Data [counts/sec] with red squares. It should show a level background at the beginning before the activity was injected, followed by a peak when the activity in the blood reaches the detector head.
- Enable the Decay correction and select the appropriate isotope from the list.
- Correct the PET Scan Start Time. Initially it is set to the time of the first twilite sample. Enter the proper PET start time. Note that time 0 in the curve display moves to the sample when the PET started. The decay correction will be applied relative to this time 0.
- Select the Average option for background subtraction.

With this setting, all samples before time 0 are averaged, assuming this is background signal only. The background average is shown as gray text and is subtracted from the Original Data before decay correction. If Enter is selected instead, the background level has to be entered manually into the number field. - Activate the Calibration factor. It has been established by the last calibration procedure, but can manually be overwritten. The calibration factor is multiplied with the background subtracted, decay corrected data, resulting in the Corrected & calibrated [kBq/cc] whole blood activity concentration. Note that the curve is truncated before time 0, assuming there was not activity.
- Save the calibrated whole blood activity concentration measurement using Save Corrected TAC. There are two formats available, from which the user has to choose in a dialog window.
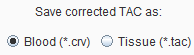
The Blood format is used for loading the result as a whole blood curve into the PKIN tool and has only one time column, the sample mid-time. The Tissue format is intended for importing the data as a tissue TAC into PKIN, and therefore has a sample start and end time column. - As an alternative, the Corrected & calibrated curve can directly be transferred to PKIN via the Kinetic Modeling button. An interface window
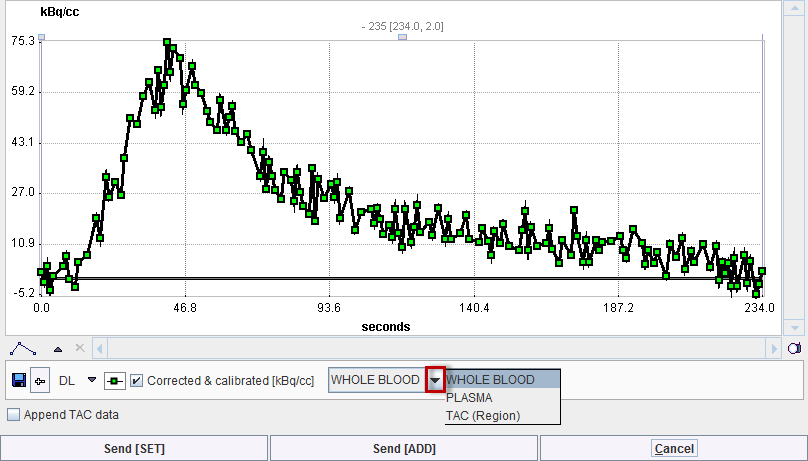
is opened which shows the curve and which has as selection, how PKIN interprets the data: as WHOLE BLOOD, PLASMA or TAC. Usually, WHOLE BLOOD should be selected. Send [SET] will overwrite data of the selected workspace in PKIN, whereas Send [ADD], will add a new PKIN workspace for the transferred data.